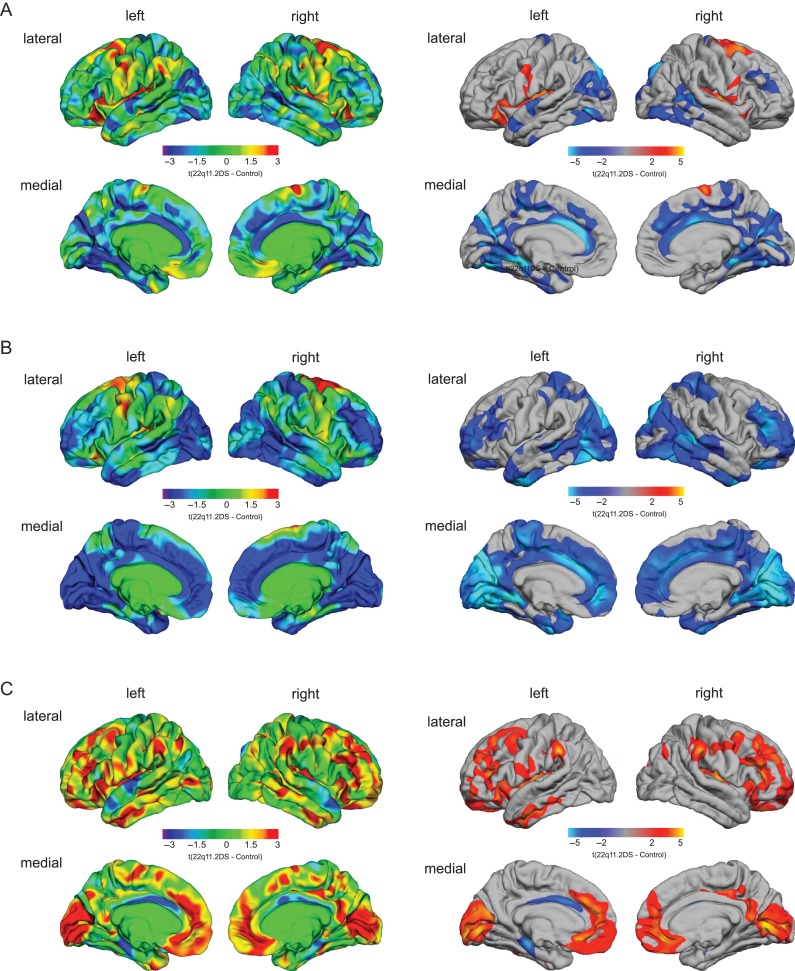
Figure 1.
Significant differences in cortical volume (A), surface area (B), and cortical thickness (C) in individuals with 22q11.2DS compared with neurotypical controls. The left panel shows the unthresholded t-maps where increases in 22q11.2DS relative to controls are indicated in yellow-red (i.e., 22q11.2DS > controls), and decreases in cyan-blue (i.e., 22q11.2DS < controls). The right panel shows the random-field-theory (RFT)-based cluster-corrected (P < 0.05, 2-tailed) difference maps indicating significant increases (marked in red) and decreases (marked in blue) following correction for multiple comparisons.

