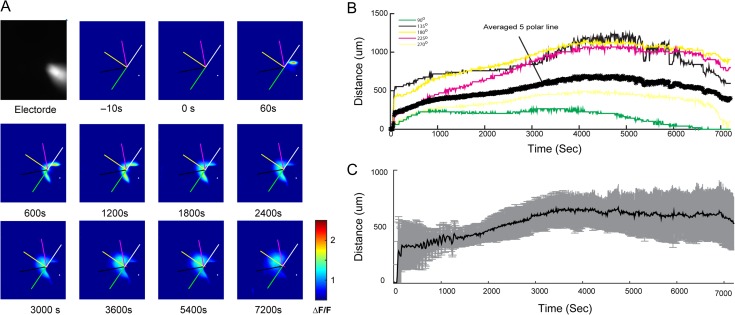
Figure 8.
Diffusion of 4-AP. (A) A glass electrode loaded with fluorescamine/4-AP solution showed strong fluorescence signals inside the neocortex before injection (top left corner gray image). Fluorescence images (ΔF/F) at selected time points after 4-AP injection in a single animal presented the amounts of diffusion at different distances from the tip of injection over times. Five polar lines (at 90°, 135°, 180°, 225°, and 270o indicated by the direction of electrode axis; 2 mm) were used for estimating the 4-AP diffusion distance. The color scale-bar is shown on the last image. (B) Time course of 5 polar lines (color traces) and averaged (thick black trace) diffusion distance in a single animal. (C) Averaged 4-AP diffusion distance over 2 h after injection (SD: gray color; n = 5 rats).

