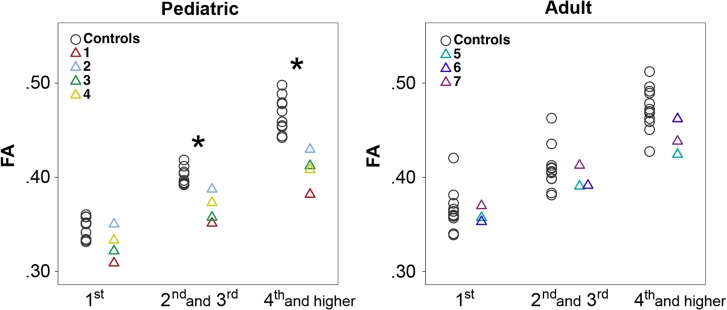
Figure 1.
Gyral-based FA values. Scatter plots of FA value for the connections between the first (short-range), second and third (middle-range), and fourth and higher (long-range) neighboring gyri in pediatric and adult subjects versus controls (*corrected P < 0.05). Pediatric subjects have significantly lower FA in middle to long-range connections compared with pediatric controls, while adult subjects show no significant differences compared with adult controls.

