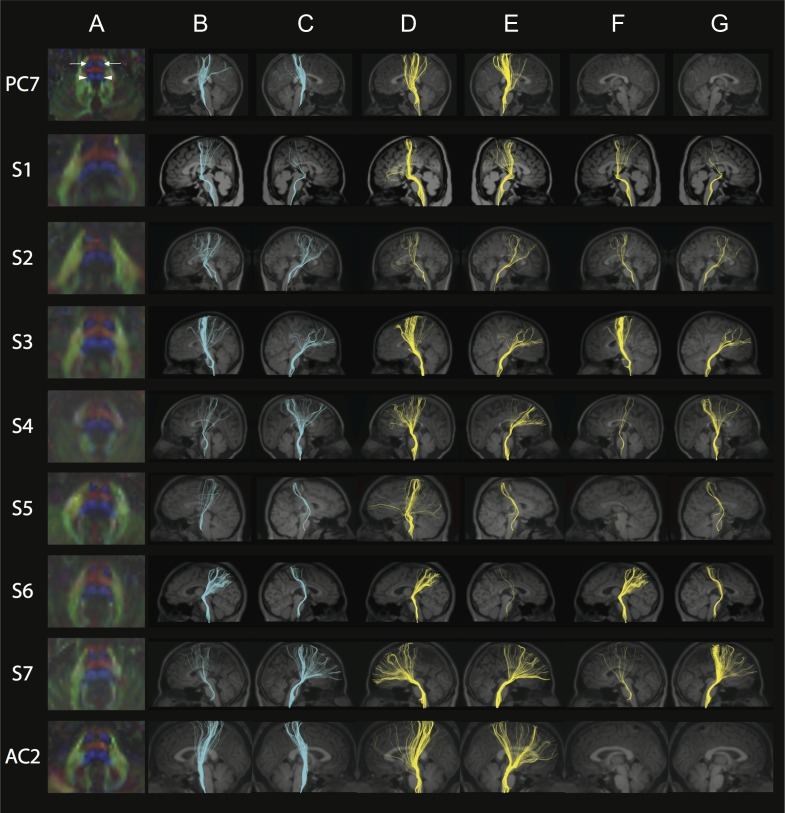
Figure 3.
FA color maps, CST, and ML. Each row represents images for a single individual with row 1: pediatric control (PC7); rows 2–5: pediatric subjects S1–S4; rows 6–8: adult subjects S5–S7; row 9: adult control (AC2). The pseudocolored fibers are overlaid on each individual’s coregistered sagittal MPRAGE shown in radiological convention in columns B–G. Column A: Axial FA color map of the midpons (typical radiological convention with left on the right and anterior at top of image), highlighting expected locations of pontine CST (bilateral anterior blue regions, anterior arrows in PC, column A) and pontine ML (bilateral posterior blue regions, posterior arrowheads in PC, column A). Note the variability in size and shape of the anterior and posterior blue regions in S1–S7 compared with controls. Color scheme represents the dominant direction of the principal eigenvector in each voxel; as per standard RGB convention for fiber direction, red corresponds to right/left, green corresponds to anterior posterior, and blue corresponds to superior/inferior. Column B: Fibers captured by one ROI placed in the left cerebral peduncle and another ROI in the ipsilateral anterior and posterior pons, anticipated to capture the left CST. Column C: Fibers captured by one ROI placed in the right cerebral peduncle and another ROI in the ipsilateral anterior and posterior pons, anticipated to capture the right CST. Note the variable CST reconstruction in subjects compared with controls in columns B and C. Column D: Fibers captured by an exclusion ROI placed in the left cerebral peduncle and an inclusion ROI placed in the ipsilateral anterior and posterior pons, anticipated to capture the left ML. Column E: Fibers captured by an exclusion ROI placed in the right cerebral peduncle and an inclusion ROI placed in the ipsilateral anterior and posterior pons, anticipated to capture the right ML. Column F: Fibers captured by two inclusions ROIs; one in the left cerebral peduncle and the other in the ipsilateral posterior pons. Column G: Fibers captured by two inclusions ROIs; one in the right cerebral peduncle and the other in the ipsilateral posterior pons. Note how in both columns F and G, there are no fibers captured in controls while subjects show abnormal tracts. See Supplementary Fig. 3A, B for pediatric and adult controls, respectively.

