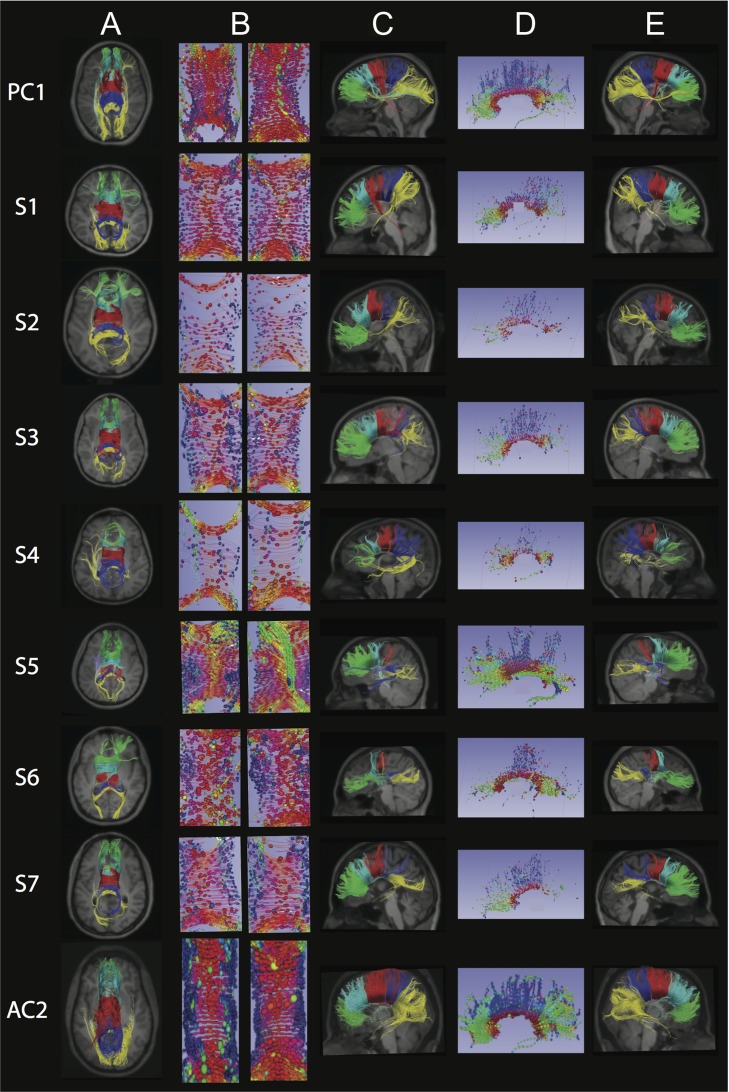
Figure 4.
Corpus Callosum (CC): Each row represents images for a single individual with row 1: pediatric control (PC1); rows 2–5: pediatric subjects S1–S4; rows 6–8: adult subjects S5–S7; row 9: adult control (AC2). The pseudocolored fibers are overlaid on each individual’s coregistered structural MPRAGE image presented in standard radiology convention in columns A and C. In column E, anterior is to the right. Column A: Axial view of five CC segments of equal length and psuedocolored as follows: green = anterior CC, turquoise = mid-anterior CC, red = central CC, dark blue = mid-posterior CC, yellow = posterior CC. Column B: Axial central segment of the CC from superior (left) and inferior (right) views, with ellipsoids showing orientation and organization of the fibers using standard RGB conventions for fiber direction. Column C: Left sagittal view of five pseudocolored CC segments as per column A. Column D: Sagittal view of the CC with anterior to the left and with ellipsoids showing orientation and organization of the fibers using standard RGB conventions for fiber direction. Column E: Right sagittal view of five pseudocolored CC segments as per columns A and C. Columns B and D created via 3D Slicer via the Slicer DMRI Project (dmri.slicer.org) (Norton et al. 2017). See Supplementary Fig. 4A,B for pediatric and adult controls, respectively.

