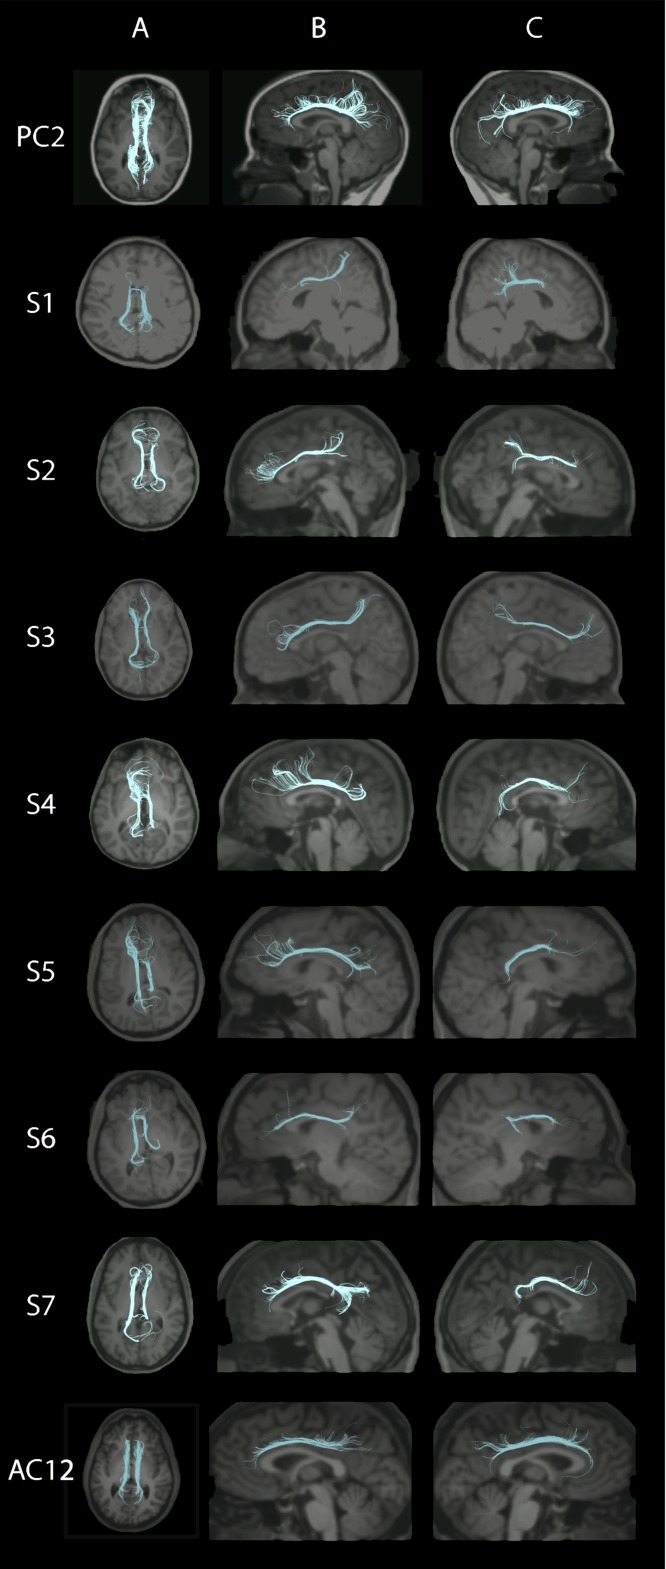
Figure 7.
Cingulum. Each row represents images for a single individual with row 1: pediatric control (PC2); rows 2–5: pediatric subjects S1–S4; rows 6–8: adult subjects S5–S7; row 9: adult control (AC12). The pseudocolored fibers are overlaid on each individual’s’ structural MPRAGE image, presented in standard radiological convention in columns A and B, while in column C, anterior is to the right. Column A: Axial view of the Cing bilaterally. Column B: Left hemisphere showing the Cing. Column C: Right hemisphere showing the Cing. Note that fibers are more disorganized and in most cases fewer in number in subjects compared with controls. See Supplementary Fig. 7A,B for pediatric and adult controls, respectively.

