Figure 2.

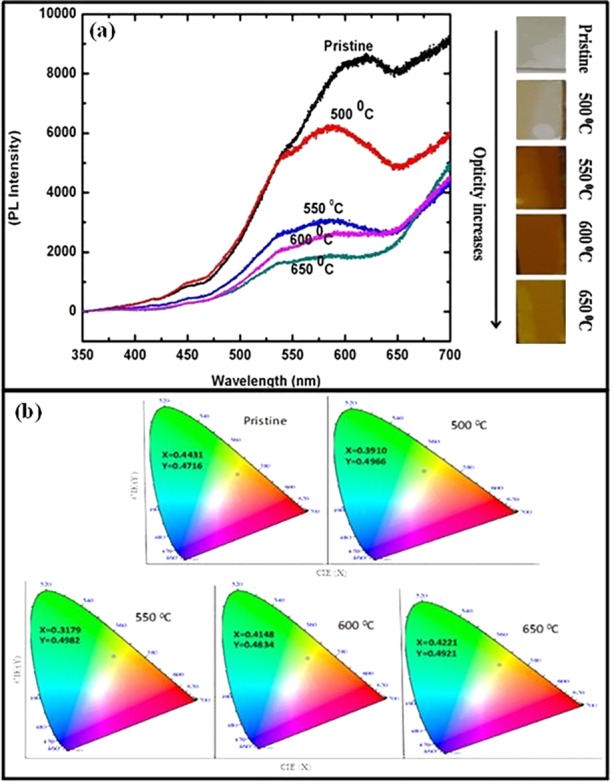
(a) PL spectra of pristine and annealed samples with opacity order, (b) the CIE diagram for pristine and annealed samples from 500 to 650 °C for 1 h. Photoluminescence (PL) spectra.

(a) PL spectra of pristine and annealed samples with opacity order, (b) the CIE diagram for pristine and annealed samples from 500 to 650 °C for 1 h. Photoluminescence (PL) spectra.