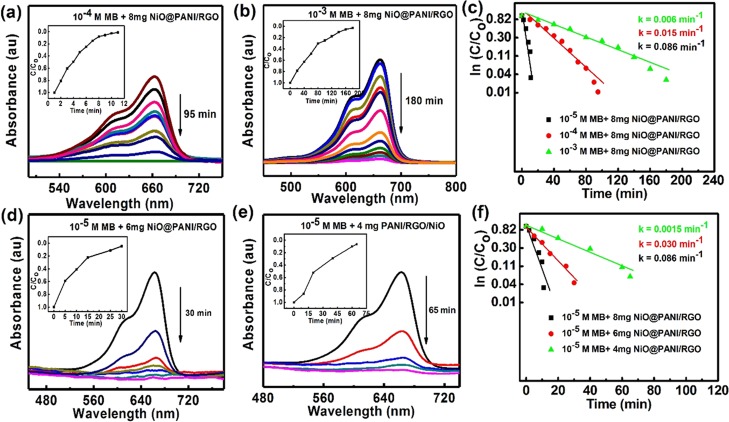
Figure 6.
UV–vis spectra for MB degradation (a) 10–4 M and (b) 10–3 M in the presence of 8 mg NiO@PANI/RGO photocatalyst. The inset shows their respective C/C0 vs time plots, (c) plot of ln(C/C0) vs time to analyze the kinetics; UV–vis spectra for MB degradation in the presence of NiO@PANI/RGO (d) 6 mg and (e) 4 mg. The inset shows their respective C/C0 vs time plots and (f) plot of ln(C/C0) vs time to analyze the kinetics with different concentrations of the photocatalyst.

