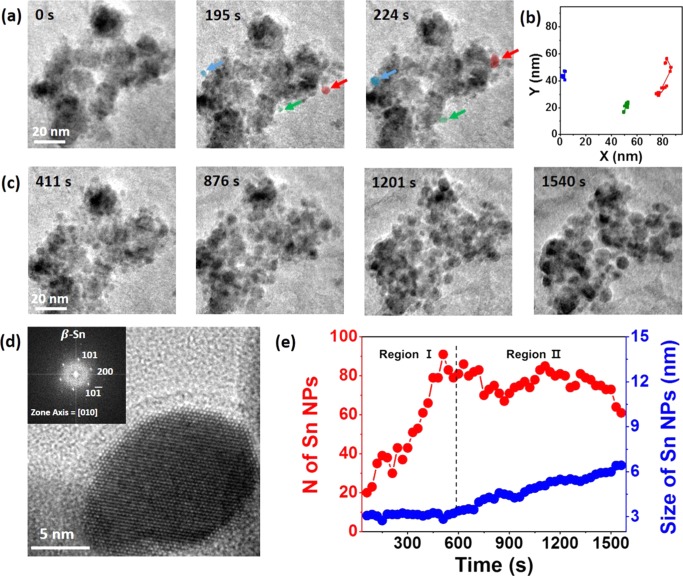
Figure 2.
(a) Time-series TEM images of SnO2 NPs undergoing the conversion reaction, where Sn NPs move along the amorphous shell to be attached to another Sn NP along the surface. (b) Trajectories of red, green, and blue particle motion in the solution based on the movie. (c) Time-series TEM images showing the nucleation and growth of Sn NPs, with increase in the size of Sn NPs with respect to the observation time. (d) HRTEM image of Sn NPs embedded in the amorphous region (inset: fast Fourier transform (FFT) pattern of Sn NP), confirming β-Sn NP structure. (e) The number (red) and average size (blue) of Sn NPs during the in situ observation in (a) and (c) vs time.

