
Figure 8.
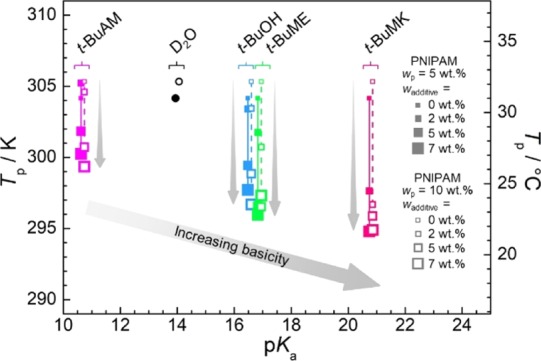
Plot of the phase separation temperature Tp (data from Figure 7a,b) as a function of pKa of additives and its content (wadditive) for both 5 and 10 wt % of PNIPAM. The values of pKa correspond to nondeuterated additives: t-BuAM (pKa = 10.68),46t-BuOH (pKa = 16.54),47t-BuME (pKa = 16.89),48 and t-BuMK (pKa = 20.8).49 The value of pKa for neat D2O is set to 14 (same as H2O) for consistency with additives. For clarity, there are slight offsets of additive pKa values for 5 and 10 wt % of PNIPAM. All values of pKa (in H2O) can be converted to pKa* (in D2O) using the approximate formula pKa = 1.076 × pKa – 0.45.50 However, this corresponds practically to a ca. +0.8 pKa unit shift (i.e., to more basic) of the experimental points, and so it does not change the character of the plot.