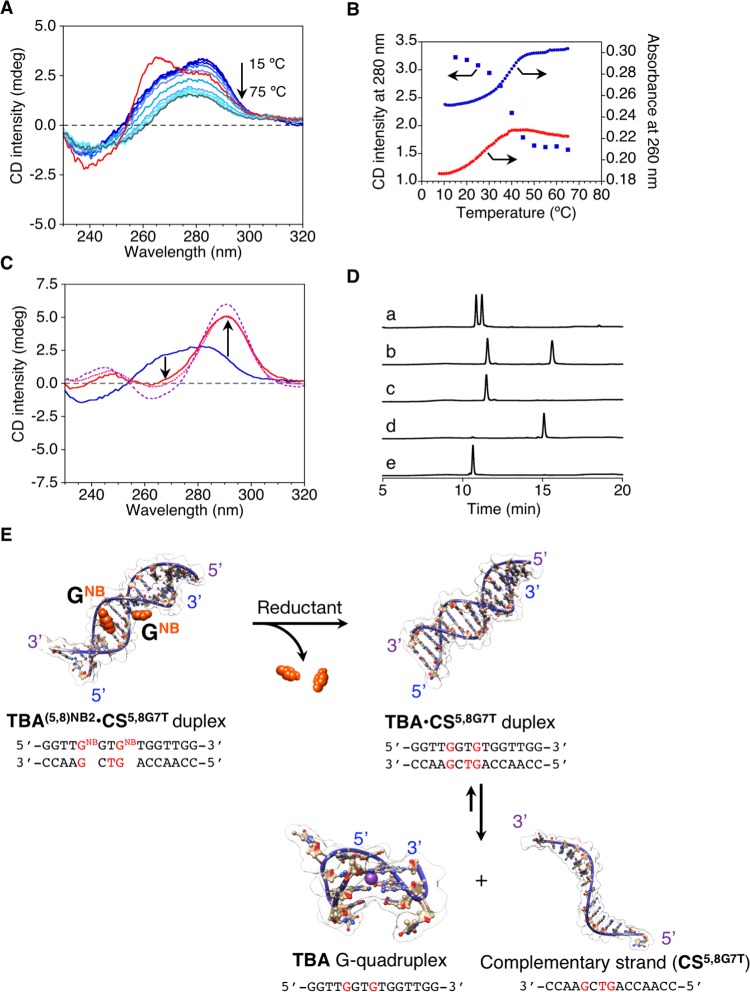
Figure 4.
(A) CD spectral changes during thermal melting for TBA(5,8)NB2·CS(5,8)G7T (blue lines: from 15 to 70 °C at a 5 °C interval, gray line: 75 °C) and CD spectrum of TBA·CS5C (red line). (B) Representative thermal CD (280 nm, blue squares for TBA(5,8)NB2·CS(5,8)G7T) and UV (260 nm, blue circles for TBA(5,8)NB2·CS(5,8)G7T, red circles for TBA·CS(5,8)G7T) melting curves. (C) CD spectra of the TBA(5,8)NB2·CS(5,8)G7T duplex before (blue line) and after (red line) addition of Na2S2O4. CD spectrum of a solution containing TBA and CS(5,8)G7T (pink dotted line) and the theoretical sum of the CD spectra of TBA and CS(5,8)G7T (purple dashed line) are also shown. The experimental temperature was set at 30 °C. (D) IP RP HPLC chromatograms of (a) TBA(5,8)NB2·CS(5,8)G7T duplex after addition of Na2S2O4, (b) TBA(5,8)NB2·CS(5,8)G7T duplex before addition of Na2S2O4, (c) CS(5,8)G7T, (d) TBA(5,8)NB2, and (e) TBA (detection at 260 nm). Conditions: TBA(5,8)NB2·CS(5,8)G7T (10 μM), Na2S2O4/TBA(5,8)NB2·CS(5,8)G7T = 1050 ([Na2S2O4] = 10.5 mM), 100 mM HEPES (pH 7.0) buffer with 0.1 mM EDTA and 105 mM KCl, and 0.1 cm cell length. (E) Schematic representations showing reduction-triggered dissociation of double-stranded helix to simultaneously form the G-quadruplex with the release of a nearly complementary strand.

