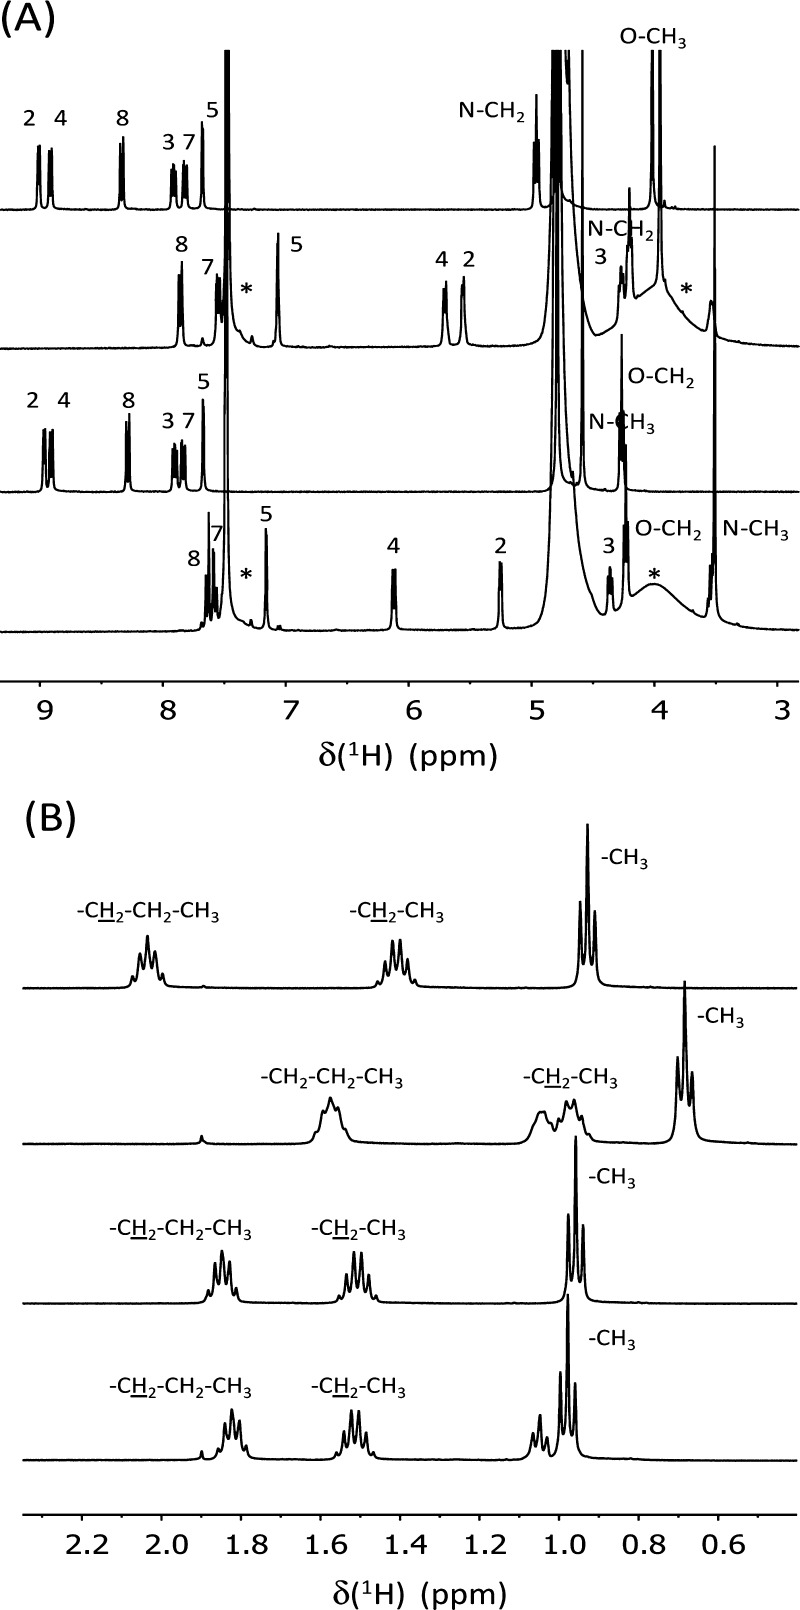
Figure 4.
From top to bottom: 1H NMR spectra of 10 mM C4C1OQ+, 3.3 mM C4C1OQ+ + 6.7 mM SCX4 mixture, 10 mM C1C4OQ+, and 3.3 mM C1C4OQ+ + 6.7 mM SCX4 mixture in D2O at 298 K. The asterisks denote the peaks related to the SCX4 protons; (A,B) correspond to two distinct spectral ranges. The small triplet at 1.05 ppm results from an impurity present in the SCX4 compound. (The spectrum of neat SCX4 solution displays this small contribution.)

