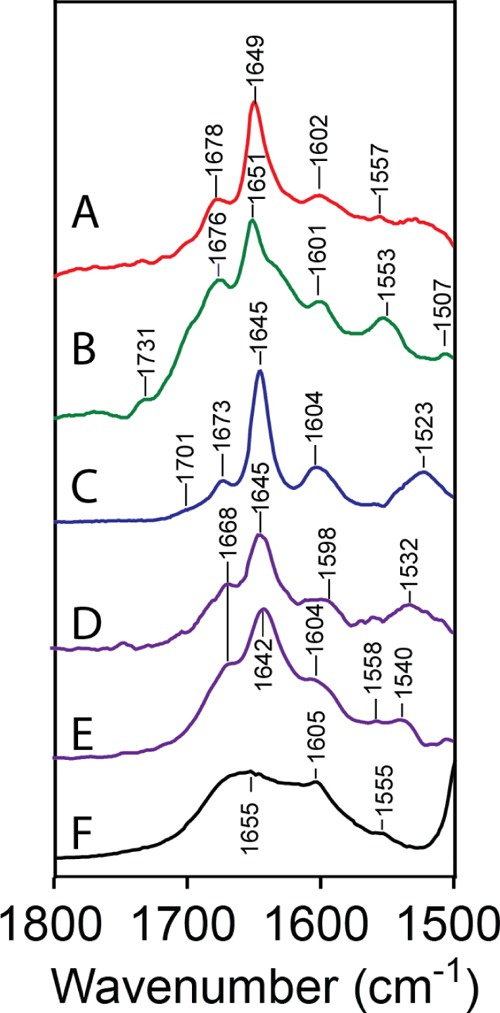
Figure 1.

IR spectra of dodecylguanidine free base (2). Most spectra were measured as saturated solutions in dry nonpolar solvents: benzene (A); CCl4 (B); CH2Cl2 (C); CHCl3 (D). An additional solution spectrum was measured in water-saturated CHCl3 (E). A sixth spectrum (F), provided for comparison, represents crystalline (p-phenolyl)-dodecyl-guanidine free base (15) measured as a KBr pellet. Vertical scales were matched to facilitate comparisons. (More extensive ranges of these spectra from 1800 to 1100 cm–1, and also including the corresponding 15N isotope-labeled compounds 2′ and 15′, are provided in Figures S-3–S-12 in Supporting Information.)
