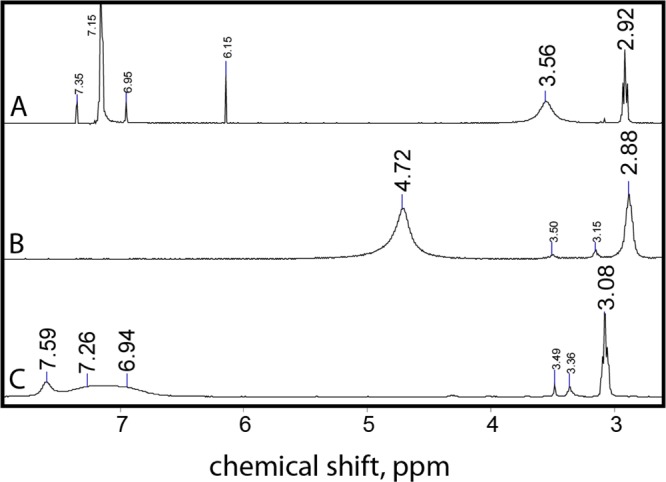
Figure 2.

1H NMR spectra of dodecylguanidine free base (2) at a concentration of 4 mM in benzene-d6 (A) and 80 mM in DMSO-d6 (B). Dodecylguanidinium bromide (1) was measured at a concentration of 100 mM in DMSO-d6 only (C), due to insufficient solubility in benzene-d6. All samples were at 25 °C. This spectral region was selected because no resonances were observed further downfield, and upfield resonances included only those from the alkyl chain, DMSO solvent, and tetramethylsilane (TMS) standard. In the original data (not shown), the signal for the −CH2– group next to the guanidine (3.08–2.88 ppm) was a well-resolved triplet with J = 7.0 Hz splitting and 3–4 Hz line width. The spectra were replotted here after various degrees of Fourier smoothing, to simplify visualization of this α-methylene resonance and the broader one from the four to five N–H protons (7.59–3.56 ppm, 100–300 Hz line widths), as well as smaller peaks near 3.5 ppm, on the same vertical scale. The resonance at 7.15 ppm in A, due to residual protons on benzene-d6, still had to be truncated at ∼10% of its full height to allow the solute resonances to be visualized. Other signals indicated with smaller fonts represent additional solvent contaminants. See text for details.
