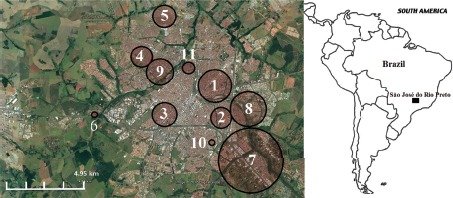
FIGURE 2. Spatial location of statistically significant clusters of confirmed cases of dengue, with the maximum number of households in the study area set to 10%, in a study of a spatiotemporal method of dengue surveillance in São José do Rio Preto, São Paulo, Brazil, January – December 2009.

Source:Prepared by the authors from the study data.
