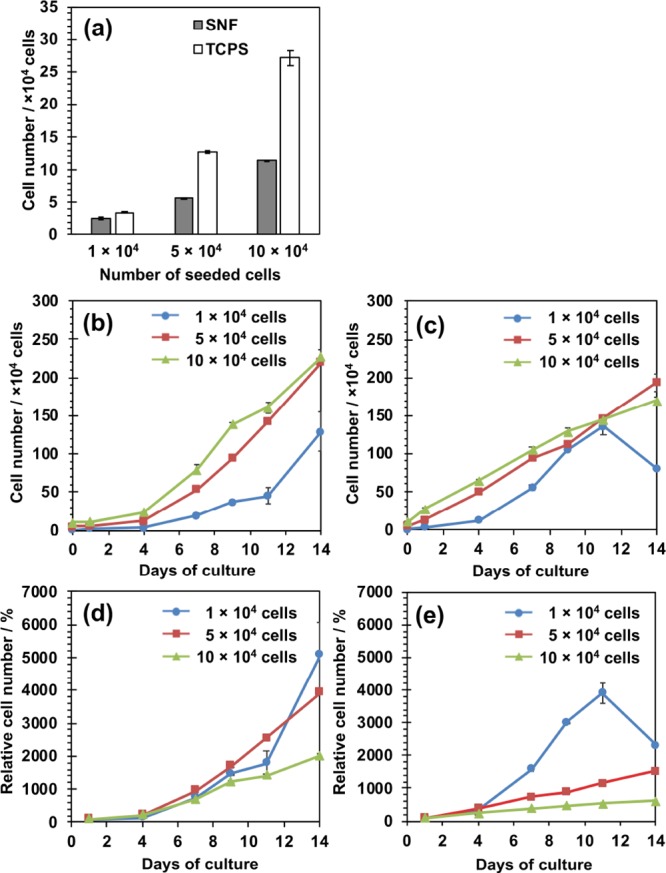
Figure 4.

Adhesion and proliferation of human MSCs on 3D SNFs and TCPS plates measured using a WST-8 assay. (a) Number of cells on the 3D SNF and TCPS plates after 24 h of culture; (b,c) number of cells on the 3D SNF (b) and TCPS plates (c) seeded at various densities, 1 (circle), 5 (square), and 10 (triangle) × 104 cells/well; (d,e) relative cell numbers to those after 24 h of culture on the 3D SNF (d) and TCPS plates (e) seeded at various densities, 1 (circle), 5 (square), and 10 (triangle) × 104 cells/well. Data are shown as the mean ± the standard error of the mean (S. E., n = 2).
