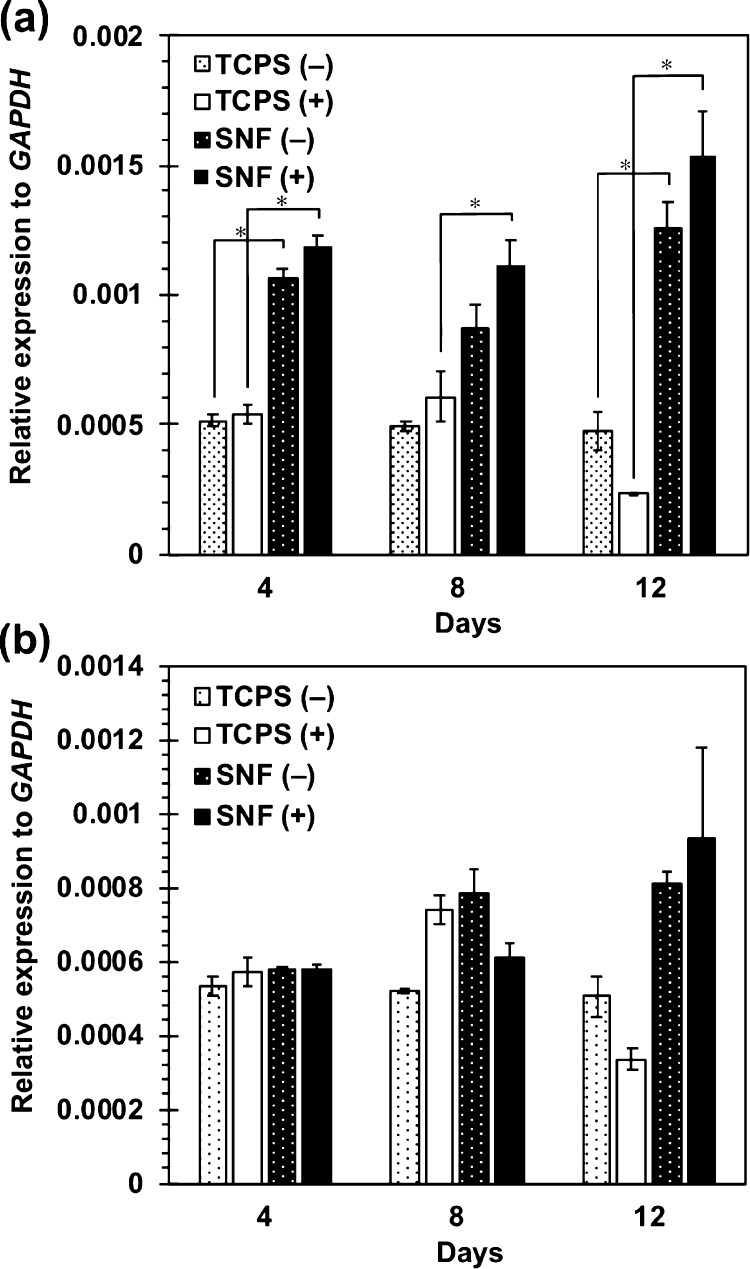
Figure 7.
Expression of RUNX2 (a) and OCN (b) in MSCs cultured on SNFs and TCPS plates under the normal medium (−) and the osteogenic differentiation medium (+). The signal intensity was normalized using that of a control housekeeping gene (human GAPDH gene). Data are shown as the mean ± S. E. (n = 2). * indicates significance (p < 0.05, Student’s t-test).

