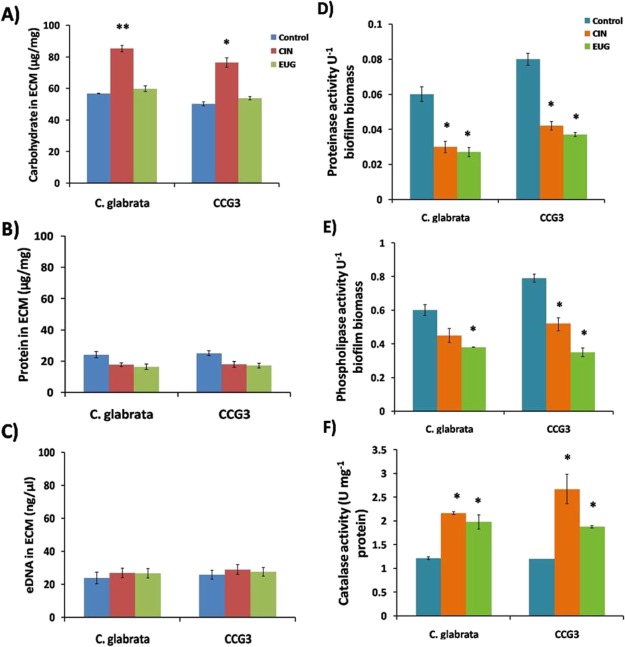
Figure 4.
Quantification of biochemical composition (A) carbohydrate; (B) protein and (C) eDNA in ECM and the specific activity of the enzymes (D) proteinase; (E) phospholipase and (F) catalase activity in C. glabrata; and CCG3 biofilm exposed to CIN (128 μg mL–1) and EUG (256 μg mL–1) after 48 h. Data represent means ± SDs of three independent experiments (**P < 0.01 and *P < 0.05).

