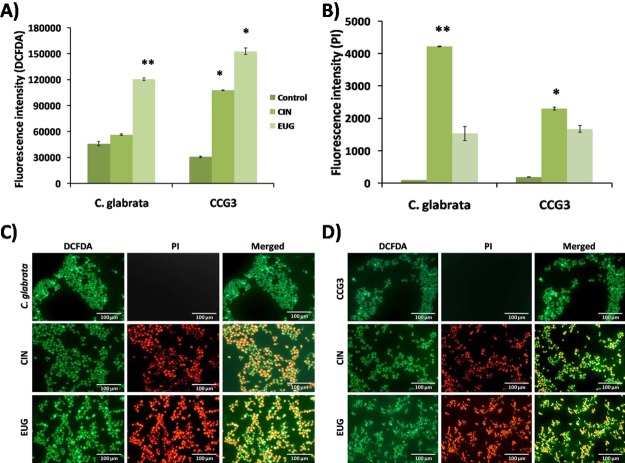
Figure 7.
Amount of ROS accumulation in terms of fluorescence intensity of (A) DCFDA and (B) PI in C. glabrata and CCG3 biofilms exposed to CIN (128 μg mL–1) and EUG (256 μg mL–1) after 48 h. Fluorescence microscopy images of ROS generation in (C) C. glabrata and (D) CCG3 biofilm for the detection of ROS (green), cell lysis (bright red), and eDNA (diffuse red). The scale bar represents 100 μm.

