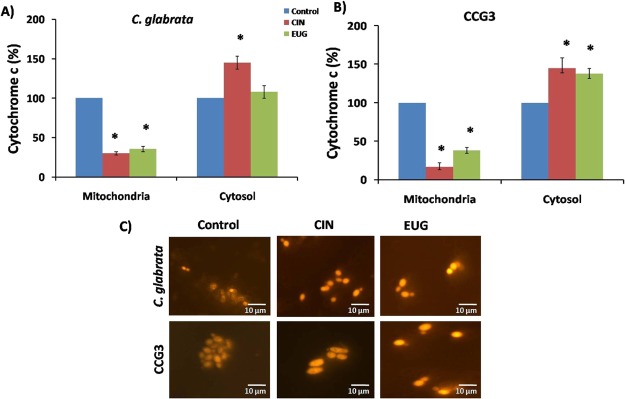
Figure 8.
Release of cytochrome c from mitochondria to cytoplasm in response to CIN (128 μg mL–1) and EUG (256 μg mL–1) treatment in (A) C. glabrata and (B) CCG3. (C) Fluorescence microscopy of C. glabrata and CCG3 cells stained with rhodamine B to study the effect of CIN (128 μg mL–1) and EUG (256 μg mL–1) on MMP. Images were taken at 60× magnification. The scale bar represents 10 μm.

