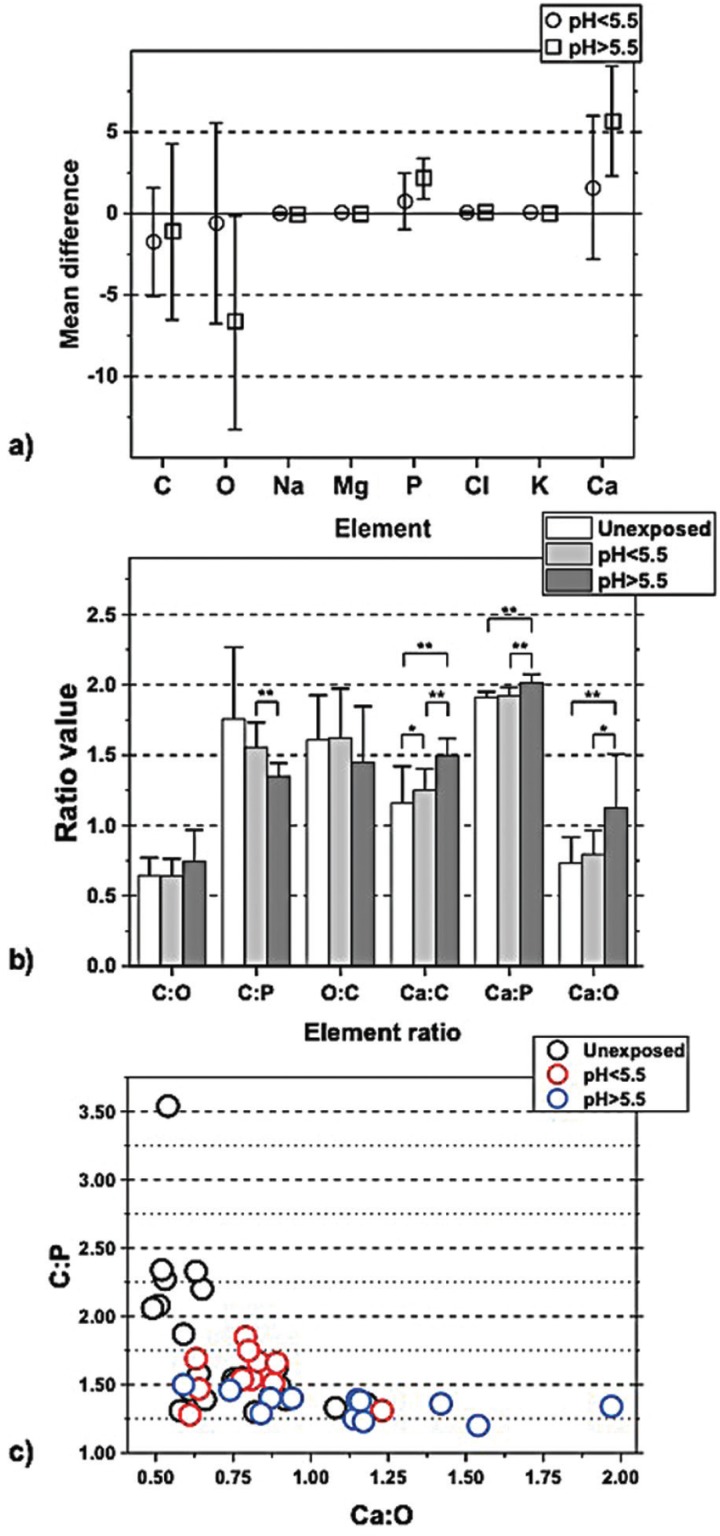
Figure 2.
a. Difference calculated for each element between exposed and unexposed enamel; the pooled pH-groups are shown separately. Higher content of O was seen in enamel exposed to H2O2 pH>5.5 (p<0.05 paired sample t-test), compared with the unexposed enamel. Additionally, a lower content of P and Ca was seen in the enamel exposed to H2O2 pH>5.5, p<0.05 paired sample t-test. b. Elemental ratios of unexposed enamel and exposed enamel of the two pooled pH-groups. Comparing the ratios in the exposed enamel of the two pooled pH-groups with independent sample t-test showed difference in ratios of C:P, Ca:P, Ca:O, and Ca:C. The ratio of C:P is lower in pH>5.5, p<0.01. Higher ratios were found of Ca:C, p<0.05 in enamel pH<5.5 compared with unexposed enamel.Higher ratios were found of Ca:P and Ca:C, p<0.001 and of Ca:O, p<0.05 in enamel pH>5.5 compared with unexposed enamel. c. Values for ratio C:P plotted in a diagram against values of ratio Ca:O, categorized in unexposed enamel and the two pooled pH-groups, respectively. The plot visualizes how the enamel is affected by hydrogen peroxide of different pH. The plot of enamel exposed to H2O2 pH<5.5 (square marks) show the most homogenous cluster pattern, considering these parameters. The enamel exposed to H2O2 pH>5.5 (cross marks) has a relatively constant low ratio of C:P, compared to the unexposed enamel, due to carbon lost in oxidation. The pattern of unexposed enamel (circle marks) show a variety of C:P, and a relatively stable ratio of Ca:O.

