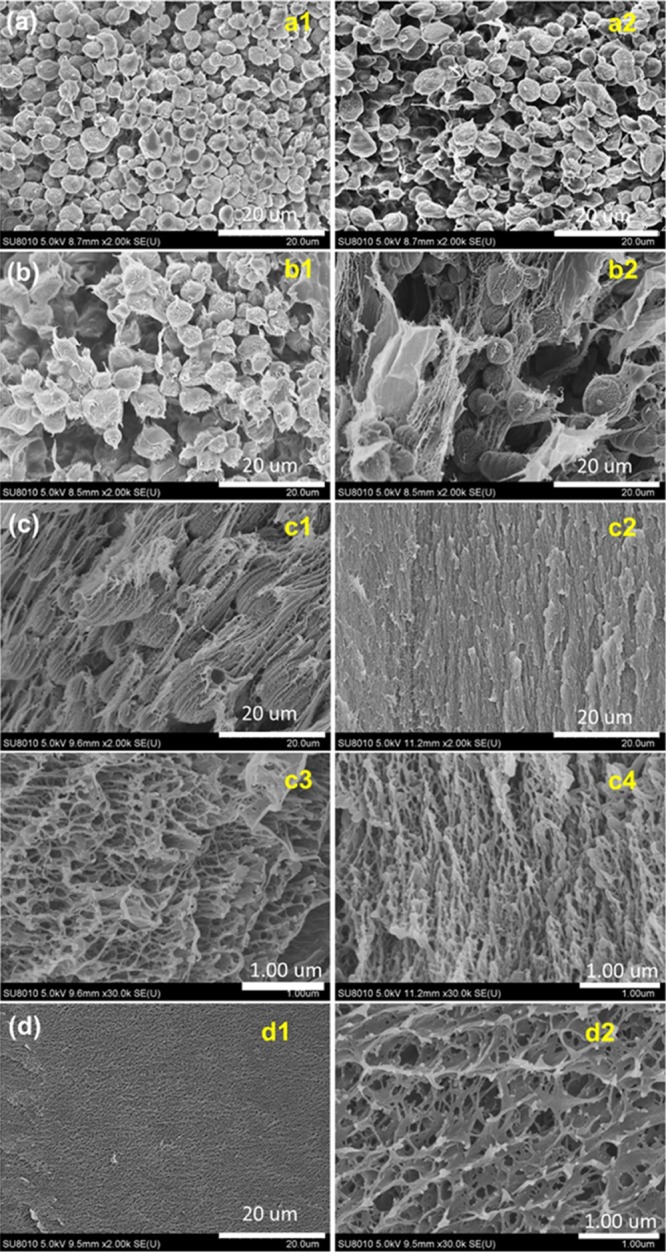
Figure 6.

SEM images of the PVA–TA hydrogels obtained at a PVA–TA concentration of 1.0 (a), 2.0 (b), 4.0 (c), and 6.0 wt % (d) at 25 °C. (a1,b1,c1) are of the upper layer and (a2,b2,c2) are of the lower layer of the gels; (c3,c4,d2) are the magnification of the corresponding (c1,c2,d1), respectively.
