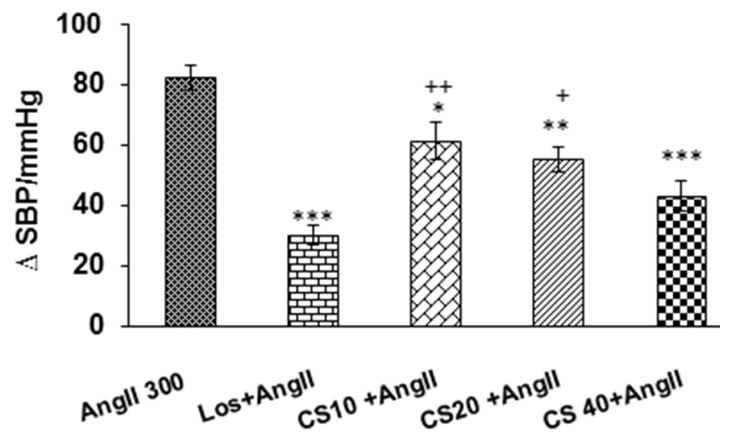
Figure 4.
Comparison peak changes of SBP induced by i.v injection of 3 doses of C. sativus extract (10, 20 & 40 mg/kg) + AngII with AngII alone and Los + AngII groups. Expression of Data: mean ± SEM (n = 6). Statistical analysis: One-way ANOVA with Tukey’s post hoc; *P < 0.05, **P < 0.01 and ***p < 0.001 vs AngII; +p < 0.05, ++p < 0. 01 vs AngII + Los; SBP: systolic blood pressure

