

Abstract

Molecular dynamics simulation studies were employed to investigate the microscopic behaviors of CH4 and CO2 molecules in slit-nanopores (SNPs) with various surfaces and different compositions. Three kinds of SNPs were constructed by a pair-wise combination of graphene, silica, and the calcite surface. The grand canonical Monte Carlo and molecular dynamics simulation methods were used to investigate the adsorption and self-diffusion of the gases in the nanopores. It is found that in all three cases, the CH4 molecules prefer to adsorb onto the graphene surface, whereas the CO2 molecules prefer to adsorb onto the calcite surface. The adsorption intensity of gases adsorbed onto various surfaces, the adsorption distances, along with the details of adsorption orientations of CH4 and CO2 molecules on various surfaces are calculated. The surface characteristics, such as surface roughness and charge distribution, are analyzed to help understand the microscopic adsorption behaviors of the gases on the specific surface. It was found that competitive adsorptions of CO2 over CH4 broadly occurred, especially in the SNPs containing calcite, because of the strong adsorption interactions between the CO2 molecules and the calcite surface. This work provides the microbehaviors of CH4 and CO2 in SNPs with various surfaces in different compositions to provide useful guidance for better understanding about the microstate of gases in complex nanoporous shale formation and to give out useful guidance for enhancing shale gas recovery by injecting CO2.
1. Introduction
The extraction of unconventional natural gas has captured great attention because of global energy shortage and the increasing demand of energy consumption in the global energy markets.1−6 Shale gas, as one of the remarkable unconventional resources, has been successful exploited and commercially used in the last decade, especially in the U.S.7 Recently, to avoid serious environmental issues caused by the high-volume hydraulic fracturing,8−10 a promising technique was put forward by injecting CO2 to enhance shale gas recovery (CO2-EGR), apart from overcoming the problems of shale gas extraction, which also could achieve CO2 capture and storage to conquer the environmental issue of global climate.11,12 Understanding the microscopic behaviors of CH4 and CO2 in nanoporous shale is crucial for the progress of the CO2-EGR technique.
Shale is a complex sedimentary rock, which has consolidated and deposited sediments with various chemical compositions, and according to the literature, the inorganic minerals and organic matter constitute the main body of shale.13−15 As it is well-known, ultralow permeability is the principal feature of the shale reservoir, and vast majority of shale gas is adsorbed in the nanoscaled pores of shale formation.16,17 Because the structure of the nanoporous shale is very complex, a lot of uncertainty always exists for the shale gas reserve due to the very variety of the shale layer condition, let along the shale gas extraction. Investigation of the microscopic behaviors of gases in shale is essential for the revolution of EGR techniques, which is obviously not easy, whereas the computer simulation provides a feasible way.
Recently, the adsorption of CH4 and CO2 in nanoporous matters, including zeolites, metal organic frameworks, and mimic nanopores of the layer, has been intensively studied by computer simulations,18,19 which provides relevant information and throws some light in the area of CO2-EGR.20−25 The carbon nanotubes (CNTs) and graphite slabs have been used to represent the nanopore surface, and the differences in the adsorption of CH4 and CO2 on the graphene surface and the displacement of CH4 by CO2 in CNTs have been examined.20,26 Meanwhile, the nanoporous carbons have also been used to represent the nanopores occupied by the organic matter, and the competitive adsorption properties of CO2 over CH4 have been extensively studied.21,22,25 Beyond that, the inorganic minerals of quartz, calcite, and clay have been often employed to represent the shale formation.27−29 In our previous work, we have examined the competitive adsorption of CO2 over CH4 and the displacement of CH4 by CO2 in shale nanopores of inorganic minerals30−32 and organic matter (kerogen).33 The above research provided meaningful knowledge, however, most of the current studies merely focused on the unique sorbent with a single component. The microbehaviors of CH4 and CO2 in nanopores containing different surfaces with various chemical compositions are still unclear, which is what we desire to figure out.
In this study, three kinds of slit-nanopores (SNPs) were constructed by a pair-wise combination of different surfaces of graphene, silica, and calcite. The grand canonical Monte Carlo (GCMC) and molecular dynamics (MD) methods were used to investigate the adsorption and self-diffusion of CH4 and CO2 in SNPs, and the influences of the chemical composition variation along with the change in the pore size were examined. The learning got from this work could enrich the theoretical knowledge about the microbehaviors of CH4 and CO2 in shale nanopores with different surface compositions and should provide useful guidance in CO2-EGR.
2. Results and Discussion
2.1. Adsorption and Self-Diffusion of CH4 in SNPs with Various Surfaces
The absolute adsorption isotherms of CH4 as a single component in the specifically constructed SNPs with different surfaces are shown in Figure 1. It is found that the adsorption amount of CH4 increases with the enlarged pressure and decreases with the increasing temperature; the characteristics of the adsorption isotherms are similar to the research about adsorption of CH4 in various monocomposited nanoporous matters.21,27 It can also be found that the adsorption capacities of CH4 in SNPs with the graphene surface (Figure 1a,b) are slightly larger than those in SNPs–c composed of silica and calcite surface (Figure 1c), which might be attributed to the stronger adsorption interactions between the CH4 molecules and the graphene surface, as discussed below.
Figure 1.

Adsorption isotherms of CH4 as a single component in constructed pair-wise two-component SNPs at different temperatures: (a) SNPs–g composed of silica and graphene surface, (b) SNPc–g composed of calcite and graphene surface, and (c) SNPs–c composed of silica and calcite surface.
The density distribution of CH4 adsorbed in SNPs with various surfaces is shown in Figure 2. It is found that the density of the tight adsorption layer (TAL) of CH4 close onto the graphene surface is larger than that adsorbed close onto other surfaces; it reaches saturated state rapidly as the pressure increases; and it demonstrates that the CH4 molecules have stronger adsorption capacity onto the graphene surface. From Figure 2, it can also be found that the distances from the TALs to the adjacent pore surfaces are different, with the nearest distance to the silica surface and the farthest distance to the graphene surface.
Figure 2.

Density profiles of CH4 in various SNPs of SNPs–g (a), SNPc–g (b), and SNPs–c (c) with a pore width of ∼2 nm and the variation of pressure at 323 K.
To investigate the detailed adsorption characteristics of the CH4 molecule adsorbed close onto the various surfaces, the optimal adsorption sites and adsorption energy (Eads) of the gas molecule on different surfaces were investigated, and Eads can be expressed as33
| 1 |
in which Ea is the energy of the gas species, Es is the energy of the sorbent, and Ea+s is the total energy of the gas molecule adsorbed on the sorbent surface. As shown in Figure 3, the CH4 molecule prefers to adsorb onto the hollow site of the graphene surface with a distance of 3.42 Å, which is consistent with the research work by Yuan et al.20 For the adsorption of the CH4 molecule onto the calcite surface, the CH4 molecule adsorbed right above the positive site of Ca2+, with a distance of 2.25 Å. Meanwhile, the CH4 molecule adsorbed above the concave site and was surrounded by the hydroxyl groups on the silica surface, with a distance of 2.03 Å. These can be explained by the different distances from the TALs of CH4 to the various pore surfaces, as mentioned in Figure 2, which also demonstrates that the surface roughness also plays an important role in the adsorption of gases onto the surfaces, in addition to the different surface charge distributions. It can also be seen that Eads of the CH4 molecule adsorbed onto the graphene surface (Eads-graphene = −2.94 kcal/mol) is weaker than those on the surfaces of calcite (Eads-calcite = −2.74 kcal/mol) and silica (Eads-silica = −2.39 kcal/mol), which further demonstrates that the CH4 molecule has the strongest adsorption interactions on the graphene surface. The transformation of the single CH4 molecule adsorbed on various surfaces from the initial optimal adsorption site to the finial stable adsorption site is shown in Figure S1.
Figure 3.

Stable adsorption configurations of a single CH4 molecule adsorbed onto different surfaces of (a) graphene, (b) calcite, and (c) silica.
The effects of the changing pore size (6–30 Å) on the adsorption behaviors of CH4 molecules in nanopores with various surfaces are shown in Figure S2; it is found that in the small nanopore with a pore width of ∼6 Å, the CH4 molecules adsorbed inside the nanopores as a single layer because of the pore size limitation, and the CH4 molecules prefer to adsorb close onto the pore surface as the pore size increases.27 Meanwhile, the density of CH4 adsorbed inside the nanopores close to the graphene surface side is always larger than those on the other sides, owing to the strong affinity of CH4 with the graphene surface, as mentioned above.
The microscopic diffusion properties of CH4 molecules located within the TALs close onto the different surfaces as pore size changes were studied by the self-diffusion coefficients (Ds) with the following equation27
| 2 |
where ri(t) is the position of molecule i at time t and ri(0) is the initial position. As shown in Figure 4, Ds of CH4 molecules adsorbed onto different surfaces can be demonstrated as Ds-graphene < Ds-calcite < Ds-silica, which further demonstrates that the CH4 molecules have stronger adsorption interactions with the graphene surface than with other surfaces. It can also be found that Ds of CH4 adsorbed close onto the various surfaces increases gradually with increasing pore size.30
Figure 4.
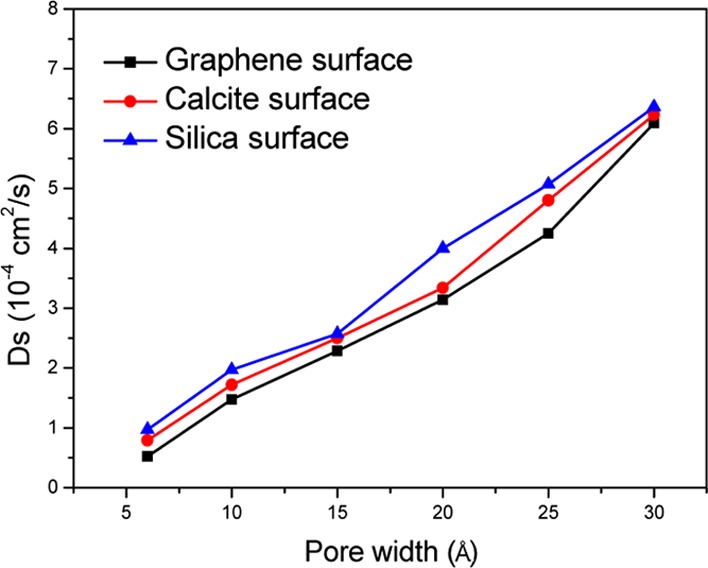
Diffusion coefficients of CH4 adsorbed close onto the different surfaces vs the pore size variation at P = 10 MPa and T = 323 K.
2.2. Adsorption and Self-Diffusion of CO2 in SNPs with Various Surfaces
The absolute adsorption isotherms of CO2 as a single component in SNPs with different surfaces are shown in Figure 5; it is found that the adsorption capacity of CO2 is stronger than CH4 in SNPs with different surfaces, which is also in agreement with our previous works that CO2 has stronger adsorption in various nanopores in comparison with CH4.30−34 From Figure 5, it can also be found that the CO2 molecules have more intense adsorption process at the initial low pressures in the SNPs with the calcite surface (Figure 5b,c), which might be attributed to the strong adsorption interactions between the CO2 molecules and the calcite surface.35
Figure 5.

Adsorption isotherms of CO2 as a single component in SNPs at various temperatures; (a) SNPs–g, (b) SNPc–g, and (c) SNPs–c.
The density distribution of CO2 adsorbed in the SNPs (d ≈ 2 nm) with various surfaces in different compositions are shown in Figure 6; it can be found that the adsorption of CO2 reaches saturated state rapidly from the initial low pressures on the calcite surface, which indicates that CO2 has a stronger adsorption intensity on the calcite surface.31 Similar to the CH4 adsorption in the nanopores, the CO2 molecules also have the largest density distribution close onto the graphene surface; it is mainly because of the close-packed arrays of CO2 molecules on the graphene surface that generates the large adsorption loading. The TALs of CO2 also have the nearest distance to the adjacent silica surface and farthest distance to the graphene surface. In contrast to CH4, the peak widths of the density distribution of CO2 within TALs close onto various surfaces are different, with the largest peak width close to the calcite surface and the smallest peak width close to the graphene surface; it is mainly because of the different adsorption orientations of CO2 adsorbed onto the various surfaces, as discussed below.
Figure 6.

Density profiles of CO2 in various SNPs of SNPs–g (a), SNPc–g (b), and SNPs–c (c) with a pore width of ∼2 nm and the variation of pressure at 323 K.
The microscopic state of the CO2 molecule adsorbed onto the various pore surfaces is shown in Figure 7; it is found that the CO2 molecule prefers to adsorb at the bridge site of the C–C bond, with two C=O bonds pointing toward the hollow sites of the neighboring carbon rings20 with a distance of 3.35 Å. The CO2 molecule adsorbed onto the calcite surface with an orientation that one of the O atoms of CO2 was attracted to the positive site of Ca2+,31 with a distance of 1.92 Å from the surface. Meantime, the CO2 molecule adsorbed onto the silica surface with a distance of 1.69 Å and with the orientation of one of the O atoms of CO2 attracted to the hydroxyl group; it is because that the hydrogen bond can be formed between the O atoms of the CO2 molecule and the hydroxyl group, according to the research work of Le at al.28 It can also be found that Eads of the CO2 molecule adsorbed onto the calcite surface (Eads-calcite = −19.20 kcal/mol) is much weaker than those on the surfaces of graphene (Eads-graphene = −3.92 kcal/mol) and silica (Eads-silica = −6.56 kcal/mol), which demonstrates that the CO2 molecule has the strongest adsorption interactions on the calcite surface. Comparing with the CH4 molecule adsorbed on various surfaces, the Eads value of CO2 is much weaker than that of CH4 on each surface, which further demonstrates that CO2 has stronger adsorption interactions with the various surfaces than CH4, especially on the calcite surface. The variation in the adsorption configurations of the single CO2 molecule adsorbed on different surfaces from the initial optimal adsorption site to the finial stable adsorption site is shown in Figure S3.
Figure 7.

Stable adsorption configurations of a single CO2 molecule adsorbed onto different surfaces of (a) graphene, (b) calcite, and (c) silica.
The angle θ formed between the CO2 backbone and the pore surfaces was quantified to investigate the difference in orientations for CO2 adsorbed within the TALs close onto various surfaces; θ is 0° or 180°represents that the CO2 molecule is perpendicular to the surface, and with θ equal to 90°, CO2 lays parallel to the surface (Figure 8a).28 It is found that CO2 adsorbed onto the graphene surface mainly parallel to the surface with θ ≈ 90°, whereas CO2 adsorbed onto the silica and calcite surface with θ ≈ 50° (∼130°) and ≈20° (∼160°), respectively.
Figure 8.

(a) Schematic of the orientation of one adsorbed CO2 molecule and, (b) probability distribution for the angle θ of CO2 molecules adsorbed within the TALs close onto the pore surface.
The adsorption density distribution of CO2 adsorbed in SNPs with various surfaces as the pore size changes (6–30 Å) is shown in Figure S4. In contrast to CH4 adsorption in the small pore with a pore width of ∼6 Å, CO2 has two adsorption layers in SNPs–c (Figure S4c), which might be because of the smaller adsorption distance of CO2 molecules onto the silica and calcite surfaces. With the pore size increasing, the CO2 molecules also adsorb close onto the pore surface preferentially. The peak width and distance to the surfaces of the TALs of CO2 are in accordance with that mentioned above.
The self-diffusion of CO2 molecules adsorbed within the TALs onto different surfaces is shown in Figure 9; it can be found that the Ds-calcite of CO2 is much smaller than Ds-graphene and Ds-silica, which further demonstrates that CO2 has stronger adsorption interactions with the calcite surface. Ds of CO2 also gets enlarged with the increasing pore size.30 However, in contrast to CH4 (Figure 4), the Ds values of CO2 are much smaller, which demonstrates that the CO2 molecules have stronger adsorption capacities on pore surfaces.
Figure 9.

Diffusion coefficients of CO2 adsorbed close onto the different surfaces vs the pore size variation at P = 10 MPa and T = 323 K.
2.3. Competitive Adsorption of CO2 over CH4 in SNPs with Various Surfaces
The selectivity parameter (S) was employed to perform the competitive adsorption of CO2 over CH4 in SNPs, which can be expressed as36
| 3 |
where x is the fraction of the gas component in the adsorbed phase and y is the fraction of the gas component in the bulk phase. As shown in Figure 10, the competitive adsorption of CO2 over CH4 in nanopores with various surfaces broadly occurs because of the different adsorption properties of CH4 and CO2 onto various surfaces. It is found that S is always larger than 2 in SNPs–g, which increases gradually with the enlarged pressure and decreases with the increasing temperature (Figure 10a). The adsorption densities of the binary mixed CH4 and CO2 in SNPs–g at 323 K are shown in Figure S5a,d, respectively, and it can be found that the adsorption density of CO2 is larger and prefers to adsorb onto the pore surface compared with CH4; so, the competitive adsorption mainly occurs at the pore surfaces.
Figure 10.

Selectivity of CO2 over CH4 in SNPs–g (a), SNPc–g (b), and SNPs–c (c) as a function of pressure at various temperatures.
The selectivity of CO2 over CH4 in SNPg–c is shown in Figure 10b; it is found that S is very large at the initial low pressure and decreases acutely with increasing pressure. Meanwhile, a reversal point exists at a pressure of ∼1 MPa, before which the high temperature is beneficial to the competitive adsorption and turns into negative beyond the reversal point. It is because at the initial stage of adsorption, the temperature has obvious influence on the CH4 adsorption, but a slight influence on CO2 adsorption in SNPg–c; therefore, the higher temperature has significant contributions to the competitive adsorption of CO2 over CH4 at the initial stage. According to the adsorption density shown in Figure S5b,e, it can be found that the competitive adsorption mainly occurs at the side of the calcite surface.
The selectivity of CO2 over CH4 in SNPs–c is shown in Figure 10c, and it is similar to the competitive adsorption of CO2 over CH4 in SNPg–c. S in SNPs–c is also very large at the initial stage, with a reversal point at a pressure of ∼1.3 MPa. The high temperature also has significant contributions to S before the reversal point and negative influences on S beyond that point. Figure S5c,f also indicates that the competitive adsorption mainly occurs at the pore surface, especially at the side of the calcite surface.
The adsorption isotherms of CH4 and CO2 molecules as binary mixtures in various SNPs are shown in Figure S6; it can also be seen clearly that CO2 has a stronger adsorption capacity in various SNPs than CH4. The characteristics of the competitive adsorption of CO2 and CH4 as binary mixtures in SNPs with different surfaces are consistent with those in silica nanopores, as described in our previous work.34 CO2 also has stronger adsorption at the initial adsorption process in the SNPs with the calcite surface, and it is in agreement with the CO2 adsorption as a single component in SNPs.
To further investigate the differences in the adsorption intensities of gases adsorbed onto various surfaces, isosteric heats (Qst) was employed to calculate the adsorption intensity of CH4 and CO2 in nanopores with the following equation,37
| 4 |
in which Rg is the gas constant, T is the temperature, Nad is the number of adsorbates and Uad is the adsorption energy. As shown in Figure 11, the values of Qst of CO2 are larger than those of CH4 in general, especially Qst of CO2 in SNPcalcite, which has a large value at the initial stage and decreases with the enhanced adsorption amount. That is because the interaction between the CO2 molecule and the calcite surface is very strong at the initial stage, whereas less favorable sorption sites would exist as the adsorption loading gets enlarged,37 which further reveals that CO2 has strong adsorption interactions with the calcite surface. Although in SNPgraphene and SNPsilica, the Qst values of CO2 are smaller compared with that in SNPcalcite, there is a slight increase from the value of 5 to 6 as the adsorption loading is enlarged, and the slight increase in the value of Qst could be attributed to the contributions of the adsorption enthalpy caused by the intermolecular interactions of gases.23 In contrast to CO2, the Qst values of CH4 are small, and it can be found that the Qst of CH4 adsorbed in the SNPgraphene is larger than that adsorbed in SNPsilica and SNPcalcite, which further reveals that CH4 has stronger adsorption interactions onto the graphene surface.25,38
Figure 11.

Isosteric heats of CH4 (solid symbol) and CO2 (open symbol) adsorbed in SNPs constituted by the single component (SNPgraphene, SNPsilica, and SNPcalcite) with a diameter of ∼2 nm as the variation of the adsorption amount (percentage) at T = 323 K.
3. Conclusions
In this study, the microbehaviors of CH4 and CO2 in SNPs with various surface compositions were investigated by MD simulations. It is found that the CH4 molecules prefer to adsorb onto the graphene surface, whereas the CO2 molecules adsorb onto the calcite surface preferentially. Meanwhile, the adsorption energy of the single molecule of CH4 and CO2 adsorbed onto different surfaces and the isosteric heats of gases affected by the different surface compositions are examined to give out the verification. In addition to the surface charge properties, the surface roughness also plays an important role in the adsorption of gases, and both work together on the adsorption state of gases in nanopores, including the various adsorption distances to the pore surfaces and the various adsorption orientations of CO2 on different surfaces. The effects of pore size variation on the adsorption and self-diffusion of CH4 and CO2 in SNPs were also examined. A competitive adsorption of CO2 over CH4 broadly occurs in SNPs, especially in nanopores with the calcite surface because of the stronger adsorption interactions between the CO2 molecules and the calcite surface. This work provides the microbehaviors of CH4 and CO2 in SNPs with various surfaces in different compositions to provide useful guidance for better understanding about the gas behaviors in complex nanoporous shale and might give out useful guidance in CO2-EGR.
4. Models and Methods
4.1. Atomistic Models
Three kinds of SNPs with different surfaces were constructed, and each rectangular simulation box with the linear dimensions of Lx = 30.5 Å, Ly = 27 Å, and Lz was used to adjust the pore width, as shown in Figure 12. The exposed surface of silica was obtained by cleaving the surface along the (001) crystallographic orientation,38 the calcite surface was cleaved along the (101̅4) crystallographic surface according to the literature,29,39 and graphene was employed to represent the surface with the organic matter.26 The whole sorbents were regarded as rigid during the simulations, and all parameters were derived from the COMPASS40 force field. For adsorbates, a three-site and a five-site model was used to describe the CO241 and CH442 molecule, respectively; the atomic charges and bond lengths are listed in Table S1.
Figure 12.

Models of SNPs with different surfaces: (a) SNPs–g with the surface of silica and graphene, (b) SNPc–g with the surface of calcite and graphene, and (c) SNPs–c with the surface of silica and calcite. Atom: O in red, C in grey, Ca in green, Si in yellow, and H in white.
4.2. Computer Simulation Details
The COMPASS40 force field was used to perform the whole simulation in this study, and the nonbonded interactions were performed by the Lennard-Jones and Coulombic potentials with the following equation37
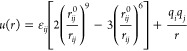 |
5 |
| 6 |
| 7 |
in which εij is the well depth, rij0 is the separation for a pair of atoms i and j, and q is the charge of the atoms. The 6th order combining rules were used to estimate the cross-potential parameters of εij and rij.
As described in our previous work,33 the GCMC method was used to examine the adsorption of CH4 and CO2 in SNPs by using the Sorption package of Materials Studio (MS). The acceptance or rejection of a trial move was performed by the Metropolis algorithm.43 The van der Waals and electrostatic interactions were described by the Lennard-Jones 9-6 potential and Coulombic term, respectively, with a cut-off distance of 10 Å. Each equilibration and calculation process had 5 × 10⁶ steps, respectively. The MD method was employed to investigate the self-diffusion of CH4 and CO2 in SNPs by using the Forcite package of MS. The NVT ensemble was employed with the temperature thermostat of Nosé–Hoover, and each MD simulation process has a run time of 5.0 ns with a time step of 1 fs; the last 1.0 ns was used for the analysis. Meanwhile, the Adsorption Locator package of MS was used to determine the initial optimal adsorption site of the single gas molecule on various surfaces by a simulated annealing process,44 and the final stable adsorption site was obtained after the geometry optimization by using the DMol3 package;45 the energy of configuration was also calculated by the DMol3 package. The generalized gradient approximation and Perdew–Burke–Ernzerhof46 were employed to describe the exchange–correlation interaction, and the density functional semicore pseudopotential47 method with the localized double-numerical basis with a polarization functional was employed.
Acknowledgments
The funding of the National Science Fund of China (Nos. 21473103 and 61575109) are gratefully acknowledged.
Supporting Information Available
The Supporting Information is available free of charge on the ACS Publications website at DOI: 10.1021/acsomega.7b01185.
Atomic charges and bond lengths of CH4 and CO2, adsorption densities of CH4 and CO2 as a single component, adsorption densities and adsorption isotherms of CH4 and CO2 as binary mixtures in SNPs, and the adsorption configurations of a single CH4 and CO2 molecule adsorbed on various surfaces (PDF)
The authors declare no competing financial interest.
Supplementary Material
References
- Kargbo D. M.; Wilhelm R. G.; Campbell D. J. Natural Gas Plays in the Marcellus Shale: Challenges and Potential Opportunities. Environ. Sci. Technol. 2010, 44, 5679–5684. 10.1021/es903811p. [DOI] [PubMed] [Google Scholar]
- Kerr R. A. Natural Gas from Shale Bursts onto the Scene. Science 2010, 328, 1624–1626. 10.1126/science.328.5986.1624. [DOI] [PubMed] [Google Scholar]
- Xin-gang Z.; Ya-hui Y. The Current Situation of Shale Gas in Sichuan, China. Renewable Sustainable Energy Rev. 2015, 50, 653–664. 10.1016/j.rser.2015.05.023. [DOI] [Google Scholar]
- He C.; You F. Deciphering the True Life Cycle Environmental Impacts and Costs of the Mega-Scale Shale Gas-to-Olefins Projects in the United States. Energy Environ. Sci. 2016, 9, 820–840. 10.1039/c5ee02365c. [DOI] [Google Scholar]
- Cooper J.; Stamford L.; Azapagic A. Shale Gas: A Review of the Economic, Environmental, and Social Sustainability. Energy Technol. 2016, 4, 772–792. 10.1002/ente.201500464. [DOI] [Google Scholar]
- Qin Y.; Edwards R.; Tong F.; Mauzerall D. L. Can Switching from Coal to Shale Gas Bring Net Carbon Reductions to China?. Environ. Sci. Technol. 2017, 51, 2554–2562. 10.1021/acs.est.6b04072. [DOI] [PubMed] [Google Scholar]
- Wang Q.; Chen X.; Jha A. N.; Rogers H. Natural Gas from Shale Formation—the Evolution, Evidences and Challenges of Shale Gas Revolution in United States. Renewable Sustainable Energy Rev. 2014, 30, 1–28. 10.1016/j.rser.2013.08.065. [DOI] [Google Scholar]
- Vengosh A.; Jackson R. B.; Warner N.; Darrah T. H.; Kondash A. A Critical Review of the Risks to Water Resources from Unconventional Shale Gas Development and Hydraulic Fracturing in the United States. Environ. Sci. Technol. 2014, 48, 8334–8348. 10.1021/es405118y. [DOI] [PubMed] [Google Scholar]
- Llewellyn G. T.; Dorman F.; Westland J. L.; Yoxtheimer D.; Grieve P.; Sowers T.; Humston-Fulmer E.; Brantley S. L. Evaluating a Groundwater Supply Contamination Incident Attributed to Marcellus Shale Gas Development. Proc. Natl. Acad. Sci. U.S.A. 2015, 112, 6325–6330. 10.1073/pnas.1420279112. [DOI] [PMC free article] [PubMed] [Google Scholar]
- Vidic R. D.; Brantley S. L.; Vandenbossche J. M.; Yoxtheimer D.; Abad J. D. Impact of Shale Gas Development on Regional Water Quality. Science 2013, 340, 1235009. 10.1126/science.1235009. [DOI] [PubMed] [Google Scholar]
- Middleton R. S.; Carey J. W.; Currier R. P.; Hyman J. D.; Kang Q.; Karra S.; Jiménez-Martínez J.; Porter M. L.; Viswanathan H. S. Shale Gas and Non-Aqueous Fracturing Fluids: Opportunities and Challenges for Supercritical Co2. Appl. Energy 2015, 147, 500–509. 10.1016/j.apenergy.2015.03.023. [DOI] [Google Scholar]
- Pei P.; Ling K.; He J.; Liu Z. Shale Gas Reservoir Treatment by a Co2-Based Technology. J. Nat. Gas Sci. Eng. 2015, 26, 1595–1606. 10.1016/j.jngse.2015.03.026. [DOI] [Google Scholar]
- Bai B.; Elgmati M.; Zhang H.; Wei M. Rock Characterization of Fayetteville Shale Gas Plays. Fuel 2013, 105, 645–652. 10.1016/j.fuel.2012.09.043. [DOI] [Google Scholar]
- Cao T.; Song Z.; Wang S.; Cao X.; Li Y.; Xia J. Characterizing the Pore Structure in the Silurian and Permian Shales of the Sichuan Basin, China. Mar. Pet. Geol. 2015, 61, 140–150. 10.1016/j.marpetgeo.2014.12.007. [DOI] [Google Scholar]
- Yingjie L.; Xiaoyuan L.; Yuelong W.; Qingchun Y. Effects of Composition and Pore Structure on the Reservoir Gas Capacity of Carboniferous Shale from Qaidam Basin, China. Mar. Pet. Geol. 2015, 62, 44–57. 10.1016/j.marpetgeo.2015.01.011. [DOI] [Google Scholar]
- Lee T.; Bocquet L.; Coasne B. Activated Desorption at Heterogeneous Interfaces and Long-Time Kinetics of Hydrocarbon Recovery from Nanoporous Media. Nat. Commun. 2016, 7, 11890. 10.1038/ncomms11890. [DOI] [PMC free article] [PubMed] [Google Scholar]
- Deliang Z.; Liehui Z.; Jingjing G.; Yuhui Z.; Yulong Z. Research on the Production Performance of Multistage Fractured Horizontal Well in Shale Gas Reservoir. J. Nat. Gas Sci. Eng. 2015, 26, 279–289. 10.1016/j.jngse.2015.06.032. [DOI] [Google Scholar]
- Getman R. B.; Bae Y.-S.; Wilmer C. E.; Snurr R. Q. Review and Analysis of Molecular Simulations of Methane, Hydrogen, and Acetylene Storage in Metal–Organic Frameworks. Chem. Rev. 2012, 112, 703–723. 10.1021/cr200217c. [DOI] [PubMed] [Google Scholar]
- Jiang J.; Babarao R.; Hu Z. Molecular Simulations for Energy, Environmental and Pharmaceutical Applications of Nanoporous Materials: From Zeolites, Metal–Organic Frameworks to Protein Crystals. Chem. Soc. Rev. 2011, 40, 3599–3612. 10.1039/c0cs00128g. [DOI] [PubMed] [Google Scholar]
- Yuan Q.; Zhu X.; Lin K.; Zhao Y.-P. Molecular Dynamics Simulations of the Enhanced Recovery of Confined Methane with Carbon Dioxide. Phys. Chem. Chem. Phys. 2015, 17, 31887–31893. 10.1039/c5cp06649b. [DOI] [PubMed] [Google Scholar]
- Lu X.; Jin D.; Wei S.; Zhang M.; Zhu Q.; Shi X.; Deng Z.; Guo W.; Shen W. Competitive Adsorption of a Binary Co2–Ch4 Mixture in Nanoporous Carbons: Effects of Edge-Functionalization. Nanoscale 2015, 7, 1002–1012. 10.1039/c4nr05128a. [DOI] [PubMed] [Google Scholar]
- Brochard L.; Vandamme M.; Pellenq R. J.-M.; Fen-Chong T. Adsorption-Induced Deformation of Microporous Materials: Coal Swelling Induced by Co2–Ch4 Competitive Adsorption. Langmuir 2012, 28, 2659–2670. 10.1021/la204072d. [DOI] [PubMed] [Google Scholar]
- Billemont P.; Coasne B.; De Weireld G. Adsorption of Carbon Dioxide, Methane, and Their Mixtures in Porous Carbons: Effect of Surface Chemistry, Water Content, and Pore Disorder. Langmuir 2013, 29, 3328–3338. 10.1021/la3048938. [DOI] [PubMed] [Google Scholar]
- Kowalczyk P.; Gauden P. A.; Terzyk A. P.; Furmaniak S.; Harris P. J. F. Displacement of Methane by Coadsorbed Carbon Dioxide Is Facilitated in Narrow Carbon Nanopores. J. Phys. Chem. C 2012, 116, 13640–13649. 10.1021/jp302776z. [DOI] [Google Scholar]
- Zhao Y.; Feng Y.; Zhang X. Selective Adsorption and Selective Transport Diffusion of Co2–Ch4 Binary Mixture in Coal Ultramicropores. Environ. Sci. Technol. 2016, 50, 9380–9389. 10.1021/acs.est.6b01294. [DOI] [PubMed] [Google Scholar]
- Wu H.; Chen J.; Liu H. Molecular Dynamics Simulations About Adsorption and Displacement of Methane in Carbon Nanochannels. J. Phys. Chem. C 2015, 119, 13652–13657. 10.1021/acs.jpcc.5b02436. [DOI] [Google Scholar]
- Zhai Z.; Wang X.; Jin X.; Sun L.; Li J.; Cao D. Adsorption and Diffusion of Shale Gas Reservoirs in Modeled Clay Minerals at Different Geological Depths. Energy Fuels 2014, 28, 7467–7473. 10.1021/ef5023434. [DOI] [Google Scholar]
- Le T.; Striolo A.; Cole D. R. Co2–C4h10mixtures Simulated in Silica Slit Pores: Relation between Structure and Dynamics. J. Phys. Chem. C 2015, 119, 15274–15284. 10.1021/acs.jpcc.5b03160. [DOI] [Google Scholar]
- Wang S.; Feng Q.; Javadpour F.; Yang Y.-B. Breakdown of Fast Mass Transport of Methane through Calcite Nanopores. J. Phys. Chem. C 2016, 120, 14260–14269. 10.1021/acs.jpcc.6b05511. [DOI] [Google Scholar]
- Sun H.; Zhao H.; Qi N.; Li Y. Simulation to Enhance Shale Gas Recovery Using Carbon Dioxide in Silica Nanopores with Different Sizes. Energy Technol. 2017, 10.1002/ente.201700166. [DOI] [Google Scholar]
- Sun H.; Zhao H.; Qi N.; Qi X.; Zhang K.; Sun W.; Li Y. Mechanistic Insight into the Displacement of Ch4 by Co2 in Calcite Slit Nanopores: The Effect of Competitive Adsorption. RSC Adv. 2016, 6, 104456–104462. 10.1039/c6ra23456a. [DOI] [Google Scholar]
- Sun H.; Zhao H.; Qi N.; Qi X.; Zhang K.; Li Y. Molecular Insight into the Micro-Behaviors of Ch4 and Co2 in Montmorillonite Slit-Nanopores. Mol. Simul. 2017, 43, 1004–1011. 10.1080/08927022.2017.1328553. [DOI] [Google Scholar]
- Sun H.; Zhao H.; Qi N.; Li Y. Molecular Insights into the Enhanced Shale Gas Recovery by Carbon Dioxide in Kerogen Slit Nanopores. J. Phys. Chem. C 2017, 121, 10233–10241. 10.1021/acs.jpcc.7b02618. [DOI] [Google Scholar]
- Sun H.; Sun W.; Zhao H.; Sun Y.; Zhang D.; Qi X.; Li Y. Adsorption Properties of Ch4 and Co2 in Quartz Nanopores Studied by Molecular Simulation. RSC Adv. 2016, 6, 32770–32778. 10.1039/c6ra05083b. [DOI] [Google Scholar]
- Tabrizy V. A.; Hamouda A. A.; Soubeyrand-Lenoir E.; Denoyel R. Co2 adsorption Isotherm on Modified Calcite, Quartz, and Kaolinite Surfaces: Surface Energy Analysis. Pet. Sci. Technol. 2013, 31, 1532–1543. 10.1080/10916466.2011.586962. [DOI] [Google Scholar]
- Zhuo S.; Huang Y.; Hu J.; Liu H.; Hu Y.; Jiang J. Computer Simulation for Adsorption of Co2, N2 and Flue Gas in a Mimetic Mcm-41. J. Phys. Chem. C 2008, 112, 11295–11300. 10.1021/jp803428n. [DOI] [Google Scholar]
- Zhou J.; Zhu X.; Hu J.; Liu H.; Hu Y.; Jiang J. Mechanistic Insight into Highly Efficient Gas Permeation and Separation in a Shape-Persistent Ladder Polymer Membrane. Phys. Chem. Chem. Phys. 2014, 16, 6075–6083. 10.1039/c3cp55498h. [DOI] [PubMed] [Google Scholar]
- Zhong J.; Wang X.; Du J.; Wang L.; Yan Y.; Zhang J. Combined Molecular Dynamics and Quantum Mechanics Study of Oil Droplet Adsorption on Different Self-Assembly Monolayers in Aqueous Solution. J. Phys. Chem. C 2013, 117, 12510–12519. 10.1021/jp401047b. [DOI] [Google Scholar]
- Durán-Álvarez A.; Maldonado-Domínguez M.; González-Antonio O.; Durán-Valencia C.; Romero-Ávila M.; Barragán-Aroche F.; López-Ramírez S. Experimental–Theoretical Approach to the Adsorption Mechanisms for Anionic, Cationic, and Zwitterionic Surfactants at the Calcite–Water Interface. Langmuir 2016, 32, 2608–2616. 10.1021/acs.langmuir.5b04151. [DOI] [PubMed] [Google Scholar]
- Sun H. Compass: An Ab Initio Force-Field Optimized for Condensed-Phase Applications Overview with Details on Alkane and Benzene Compounds. J. Phys. Chem. B 1998, 102, 7338–7364. 10.1021/jp980939v. [DOI] [Google Scholar]
- Zhang L.; Hu Z.; Jiang J. Metal–Organic Framework/Polymer Mixed-Matrix Membranes for H2/Co2 Separation: A Fully Atomistic Simulation Study. J. Phys. Chem. C 2012, 116, 19268–19277. 10.1021/jp3067124. [DOI] [Google Scholar]
- Rives S.; Jobic H.; Beale A.; Maurin G. Diffusion of Ch4, Co2, and Their Mixtures in Alpo4-5 Investigated by Qens Experiments and Md Simulations. J. Phys. Chem. C 2013, 117, 13530–13539. 10.1021/jp4042827. [DOI] [Google Scholar]
- Frenkel D.; Smit B.. Understanding Molecular Simulation: From Algorithms to Applications; Academic Press, 2001; Vol. 1. [Google Scholar]
- Kirkpatrick S.; Gelatt C. D.; Vecchi M. P. Optimization by Simulated Annealing. Science 1983, 220, 671–680. 10.1126/science.220.4598.671. [DOI] [PubMed] [Google Scholar]
- Delley B. From Molecules to Solids with the Dmol3 Approach. J. Chem. Phys. 2000, 113, 7756–7764. 10.1063/1.1316015. [DOI] [Google Scholar]
- Perdew J. P.; Burke K.; Ernzerhof M. Generalized Gradient Approximation Made Simple. Phys. Rev. Lett. 1996, 77, 3865. 10.1103/physrevlett.77.3865. [DOI] [PubMed] [Google Scholar]
- Delley B. Hardness Conserving Semilocal Pseudopotentials. Phys. Rev. B: Condens. Matter Mater. Phys. 2002, 66, 155125. 10.1103/physrevb.66.155125. [DOI] [Google Scholar]
Associated Data
This section collects any data citations, data availability statements, or supplementary materials included in this article.