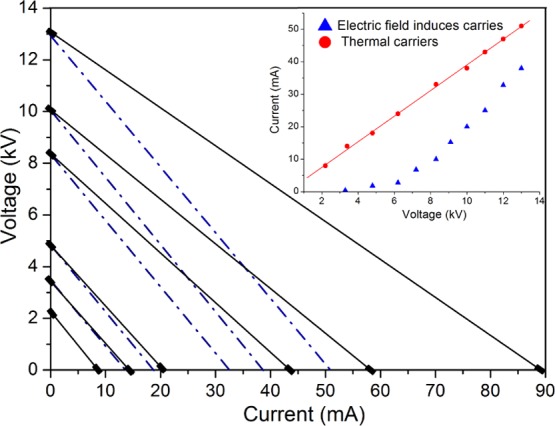
Figure 3.

Applied voltage vs current curve measured using a supported bridge arrangement formed by two capillaries in contact. The open voltage is given by the intersection of the straight line with the vertical axis, and the short-circuit current is given by the intersection with the horizontal axis. The slope of the line for the high voltage is less than that for the low voltage. The low-voltage slope, corresponding to Vi = 3.5 kV, is indicated by a dashed line; for higher applied voltages: 5, 8.2, 10, and 13 kV, the slope is indicated by full lines. The measured values are indicated by ■. The inset shows the high-voltage dissociation current vs applied voltage by ▲ and the thermal carriers (OH– and H+) by ●.
