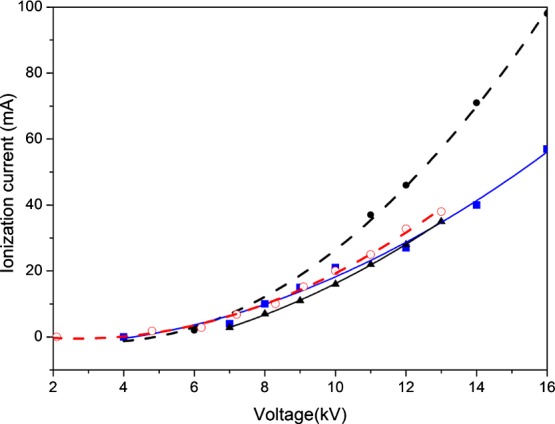
Figure 4.

Excess protonic current vs voltage curves for bridges operated at 25 °C indicated by ○, ▲, and ■ and at 35 °C indicated by ●. The solid line is the fit to an expression of the Mott–Gurney law I = JA = I0(V – V0)2, where I is the high-voltage dissociation current, J is the current density, A is the electrode area, and I0 and V0 were determined by the fitting to the experimental data.
