Figure 9.

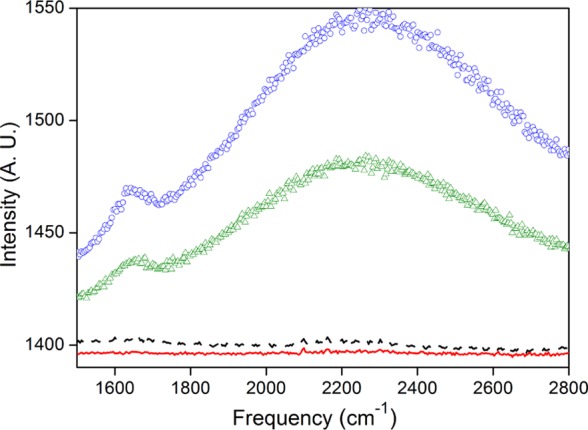
Vibrational Raman spectrum of water from 1700 to 2800 cm–1 measured at 20 °C indicated by ○, at 10 °C by △, at −4 °C by the dashed line, and at −6 °C by the full line.

Vibrational Raman spectrum of water from 1700 to 2800 cm–1 measured at 20 °C indicated by ○, at 10 °C by △, at −4 °C by the dashed line, and at −6 °C by the full line.