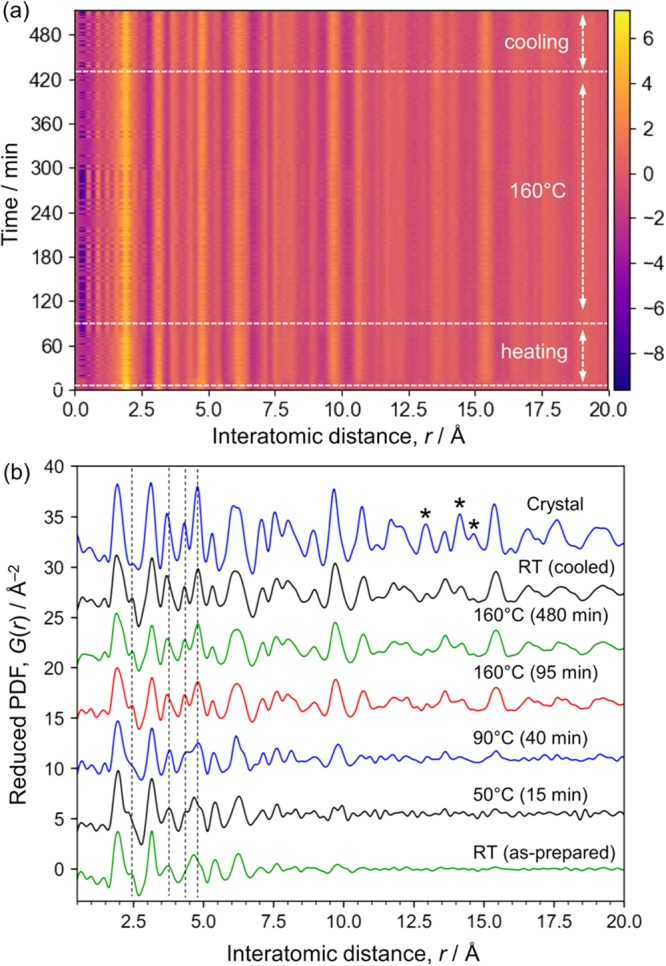
Figure 4.

Time-dependent PDF data. (a) Two-dimensional plot of time-dependent in situ PDFs. (b) Selected one-dimensional plots shown with the ex situ PDF for the crystalline product. The total scattering intensity from the solvent was subtracted and then the remaining intensity was converted into PDFs. Ten frames (or 10 min) of data were integrated for the RT data and the data obtained at 160 °C (85–95 and 470–480 min). One frame of data was used for 50 and 90 °C. The same Q range (2.0–18.9 Å–1) was used for the Fourier transform except that for the crystalline sample (1.6–18.9 Å–1).
