
Figure 8.
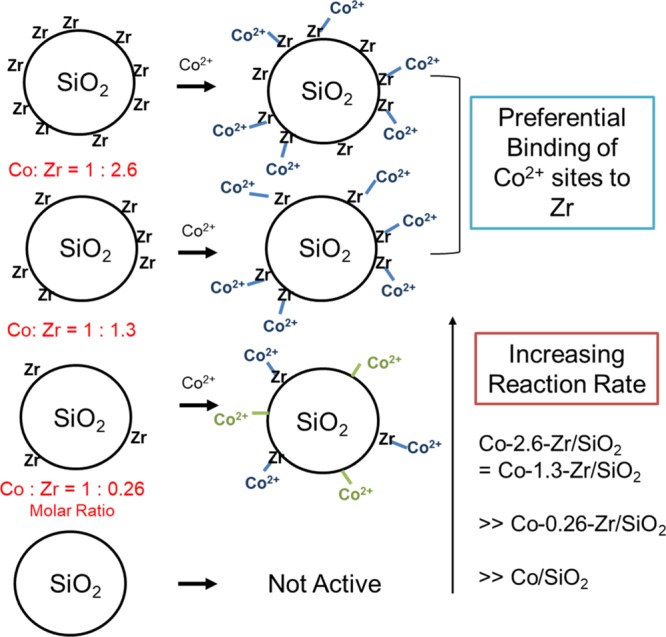
Cartoon representation of the ratio of Zr–Co in catalyst materials and Co–Zr/SiO2 catalyst site distribution. The Co–X lines (SiO2 or Zr) represent Co–O–X bonds.
Official websites use .gov
A
.gov website belongs to an official
government organization in the United States.
Secure .gov websites use HTTPS
A lock (
) or https:// means you've safely
connected to the .gov website. Share sensitive
information only on official, secure websites.
Cartoon representation of the ratio of Zr–Co in catalyst materials and Co–Zr/SiO2 catalyst site distribution. The Co–X lines (SiO2 or Zr) represent Co–O–X bonds.