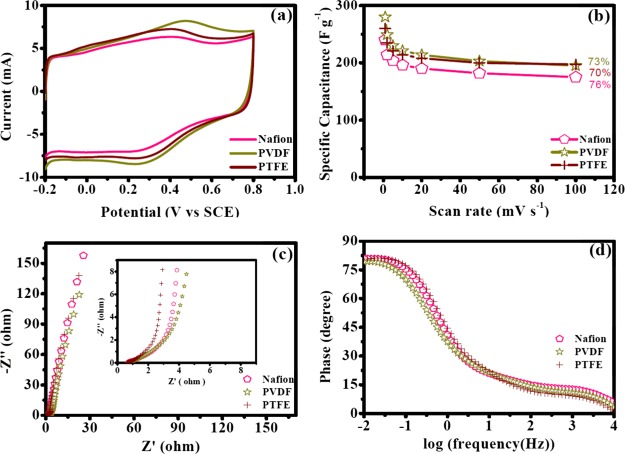
Figure 7.
Electrochemical performance of OFG with different binders (Nafion, PVDF, and PTFE) while EG was used as a solvent for OFG dispersion and the electrodes were dried at 170 °C. (a) CV curves at a scan rate of 50 mV s–1. (b) Specific capacitance dependence on the scan rates of voltammetry. (c) Nyquist plots of EIS results collected at 0.4 V vs SCE (inset: high-frequency region). (d) Bode plot (phase angle vs log frequency) of EIS experiments.

