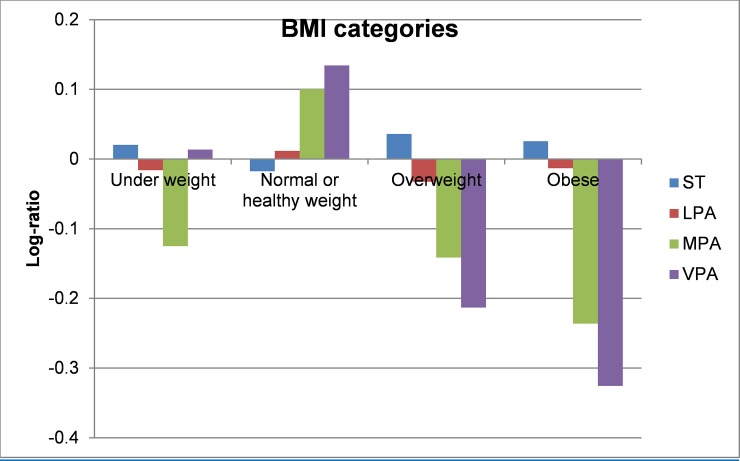
Fig 1. Compositional geometric mean bar plots comparing the compositional mean of the entire sample with the compositional mean of underweight, normal weight, overweight, and obese subgroups for sedentary time (ST), light-intensity physical activity (LPA), moderate-intensity physical activity (MPA), and vigorous-intensity physical activity (VPA).
BMI = body mass index.

