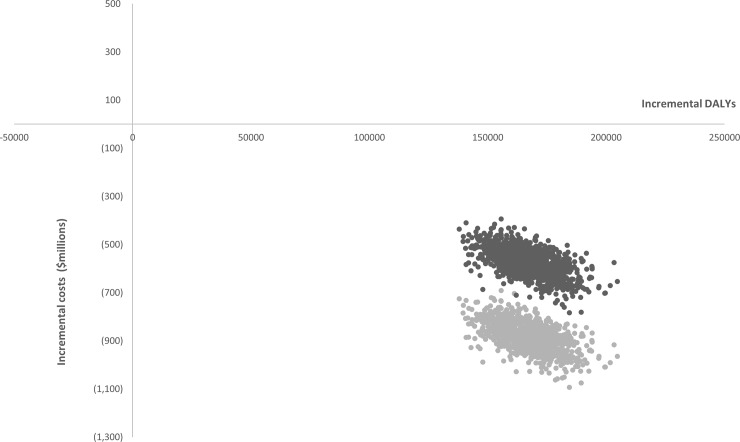
Fig 3. Bootstrapped incremental cost-effectiveness ratio plots for the junk food tax relative to status quo.
Dark points represent pairs of incremental costs saved and DALYs averted due the junk food tax based on a health system perspective. Light points represent these points after production gains have been included.

