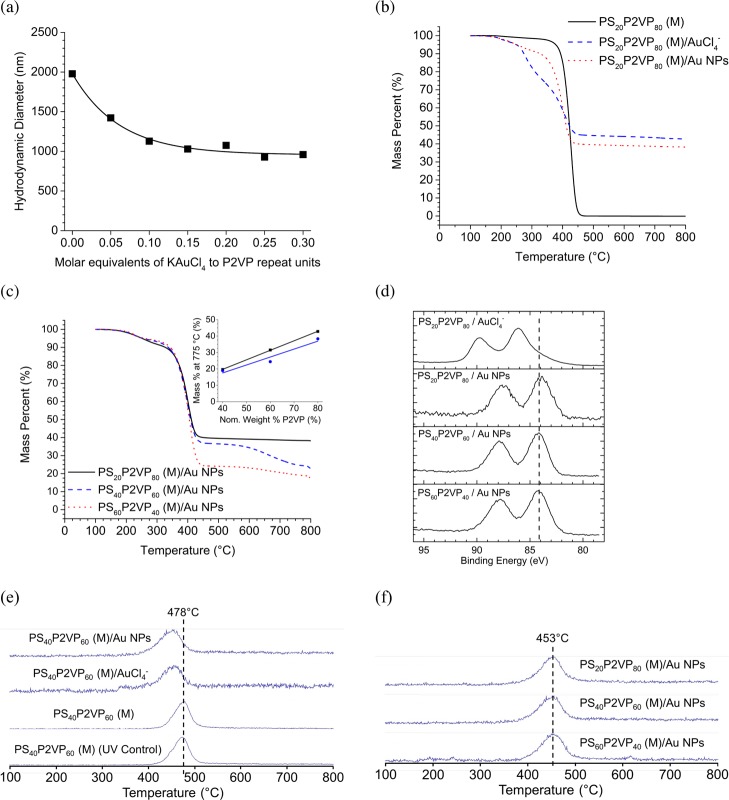
Figure 3.
(a) Titration curve monitored by DLS for PS20P2VP80 loaded with 24 mM KAuCl4(aq). The pH of the PS20P2VP80 solution and the KAuCl4 solution were both adjusted to 2.5 and the pH of the PS20P2VP80 (M) solution remained 2.5 throughout the titration. (b) TGA curves for unloaded and aurate- and Au NP-loaded PS20P2VP80 (M). (c) TGA curves for Au NP-loaded PS20P2VP80 (M), PS40P2VP60 (M), and PS60P2VP40 (M). Inset: M775°C vs the nominal P2VP weight content for the aurate-loaded (squares) and Au NP-loaded (circles) samples. (d) High-resolution X-ray photoelectron spectroscopy (HRXPS) for PS20P2VP80 (M)/AuCl4–, PS20P2VP80 (M)/Au NPs, PS40P2VP60 (M)/Au NPs, and PS60P2VP40 (M)/Au NPs. The dash vertical line indicates average binding energy of the maxima in the Au 4f7/2 signals for PSxP2VPy (M)/Au NPs. The HRXPS plot has been normalized and offset for clarity. Tracer plots for the absorbance at 1585 cm–1 (e) vs temperature for PS40P2VP60 (M), PS40P2VP60 (M)/AuCl4–, and PS40P2VP60 (M)/Au NPs. In (e), the bottom trace is for a UV-treated PS40P2VP60 (M). (f) Tracer plots for the absorbance at 1585 cm–1 versus temperature for PS20P2VP80 (M)/Au NPs, PS40P2VP60 (M)/Au NPs, and PS60P2VP40 (M)/Au NPs. The absorbance at 1585 cm–1 is associated with pyridine-containing volatiles from P2VP. In (e,f), the absorbance scale has been normalized and plots are offset for clarity.

