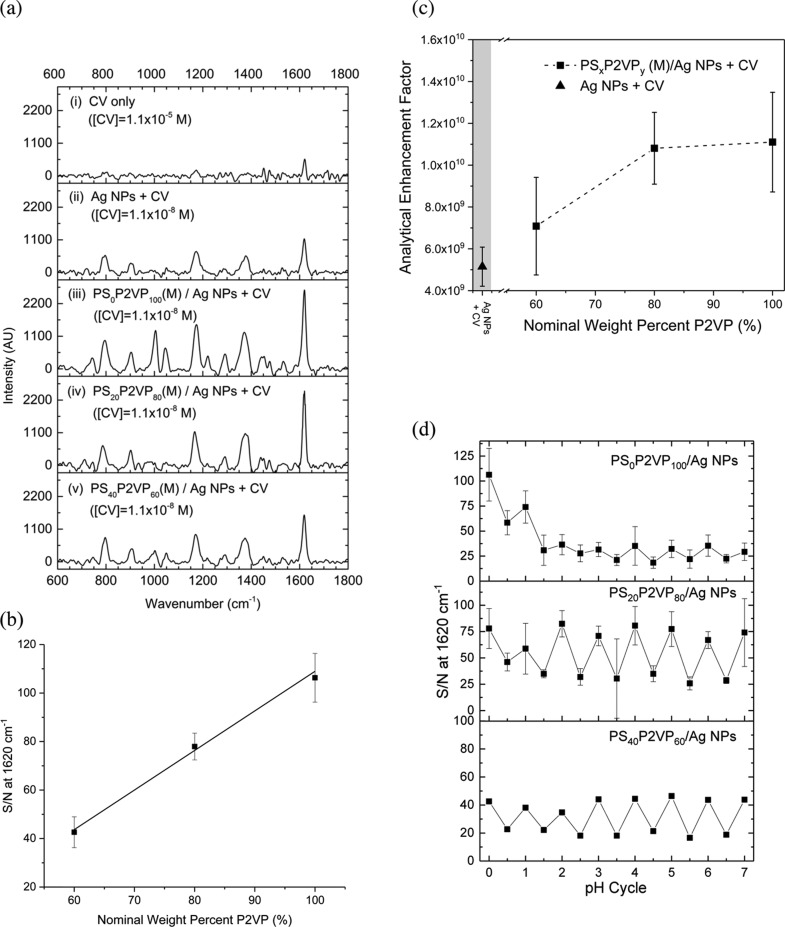
Figure 6.
(a) Initial Raman spectra of the PSxP2VPy (M)/Ag NPs and control comparisons with CV. (b) S/N ratio at 1620 cm–1 for CV for spectra acquired using PSxP2VPy (M)/Ag NPs versus the nominal P2VP weight content. (c) AEFs (for pH cycle 0) of PSxP2VPy (L)/Ag NPs versus the nominal P2VP weight content. (d) Tracking of the S/N of the 1620 cm–1 signal for CV as the PSxP2VPy/Ag NPs are cycled between the latex (integer pH cycles) and microgel (half integer pH cycles) states.

