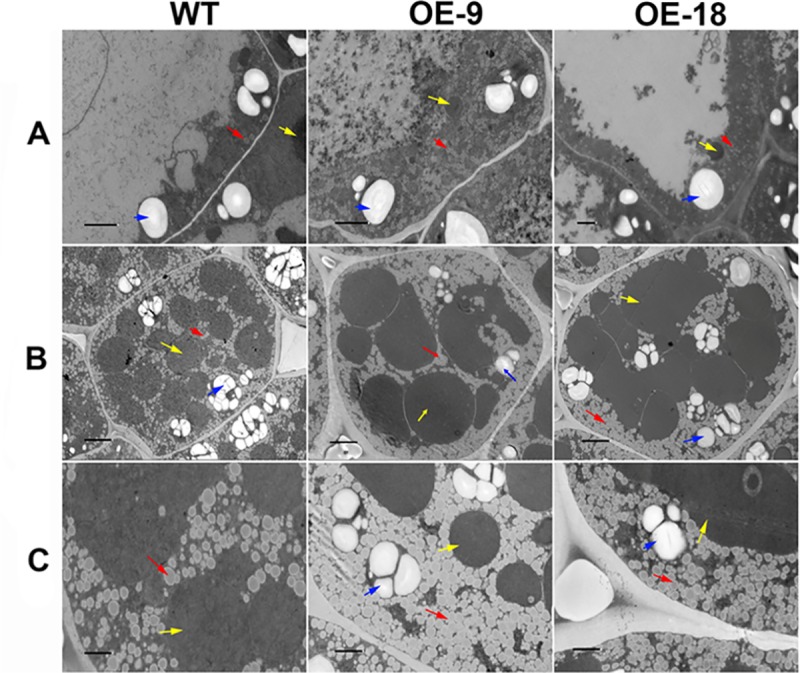
Fig 6. Microscope analyses of OBs in WT and OE seeds.

A, OBs in WT and OE seeds at 25 DAF, scale bars = 3 μm. B, Distribution of OBs in a whole seed cell at 40 DAF, scale bars = 5 μm. C, Increased magnification of OB distribution in a seed cell at 40 DAF, scale bars = 2 μm. The seed cells in OE-9 and OE-18 appear to contain smaller OBs than those in WT. Red arrows, oil body; yellow arrows, protein body; blue arrows, starch granules.
