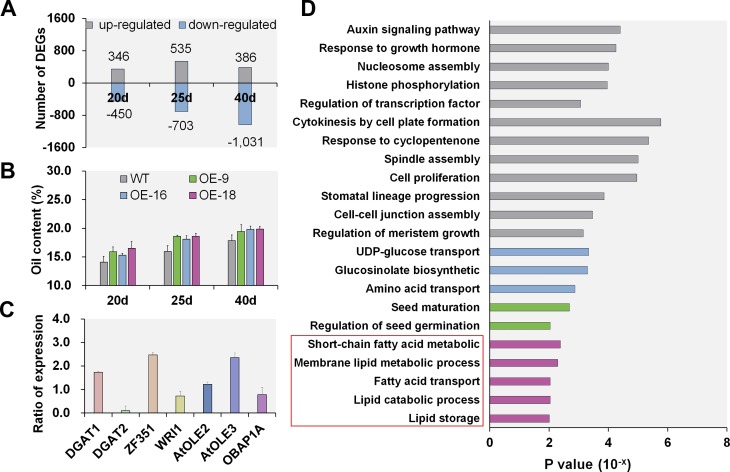
Fig 7. Comparative transcriptomic analysis of developing seeds between the OE lines and WT at different seed development stages.
A, Histograms showing the differentially expressed genes (DEGs) in OE seeds relative to WT seeds at 20, 25 and 40 DAF, respectively. B, Comparison of oil content accumulation between the OE and WT seeds at 20, 25 and 40 DAF (P < 0.01). C, Expression analysis of the putative genes involved in plant oil biosynthesis in OE-9 seeds at 40 DAF. Error bars are SD. The Y-axis represents the ratio of expression of a gene in the OE lines relative to WT, D, GO enrichment analysis for the DEGs between the OE and WT seeds at 40 DAF. Purple, green, and blue columns represent the enriched GO terms associated with oil metabolism pathway, seed germination, and protein metabolism pathway, respectively.

