Figure 2.

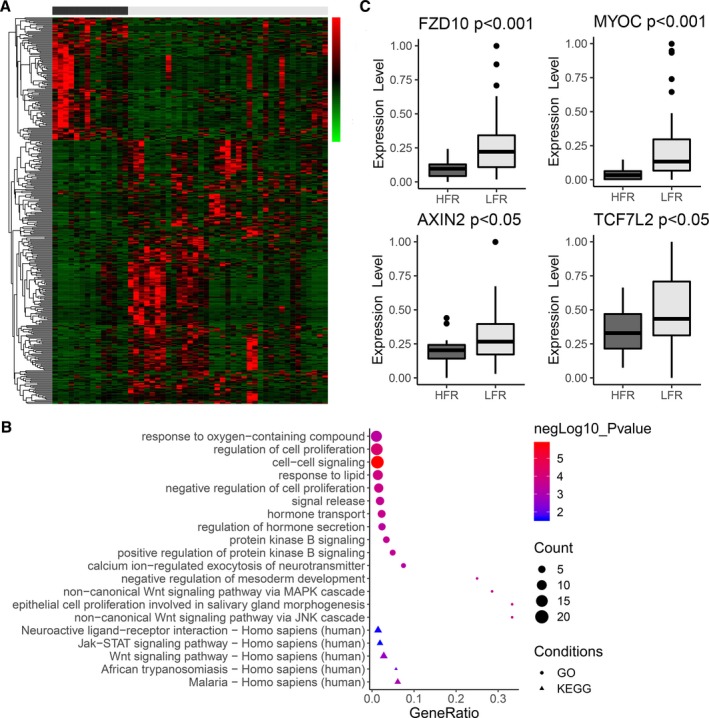
mRNA expression profiling in bAVMs. A, Gene expression heatmap of differentially expressed mRNAs (P≤0.05 and fold change ≥2 or ≤0.5) in HFR vs LFR bAVM tissues. The x‐axis shows each bAVM patient (black=HFR; gray=LFR), and the y‐axis shows individual genes. In the heatmap cells, red indicates high gene expression (ie, upregulated expression) relative to the median expression; green indicates low expression (ie, downregulated expression); black indicates that expression is similar to the median. B, Top 15 terms of GO analysis (ranked by P value) and KEGG analysis enriched by upregulated genes in LFR bAVMs. C, The expression levels of FZD10, MYOC, and downstream molecules in canonical Wnt signaling. bAVM indicates brain arteriovenous malformations; HFR, high flow rate; LFR, low flow rate.
