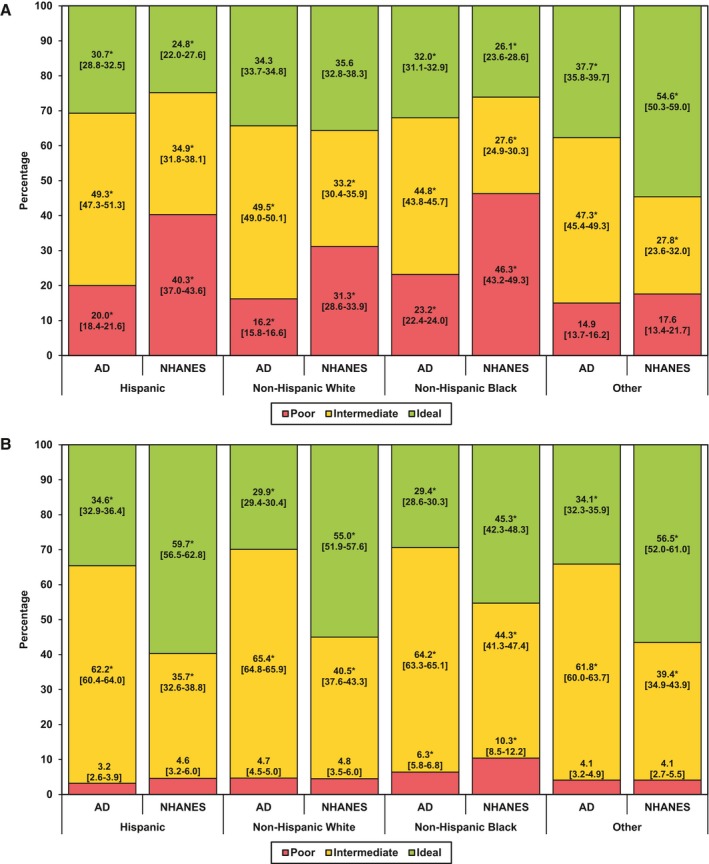
Figure 3.

Age‐standardized prevalence estimates (95% CIs) of ideal, intermediate, and poor health, for body mass index (A) and blood pressure (B), among active duty service members (AD) and the National Health and Nutrition Examination Survey (NHANES) group, by race/ethnicity. *Indicates significant differences in each cardiovascular health category between AD and NHANES groups (P<0.001).
