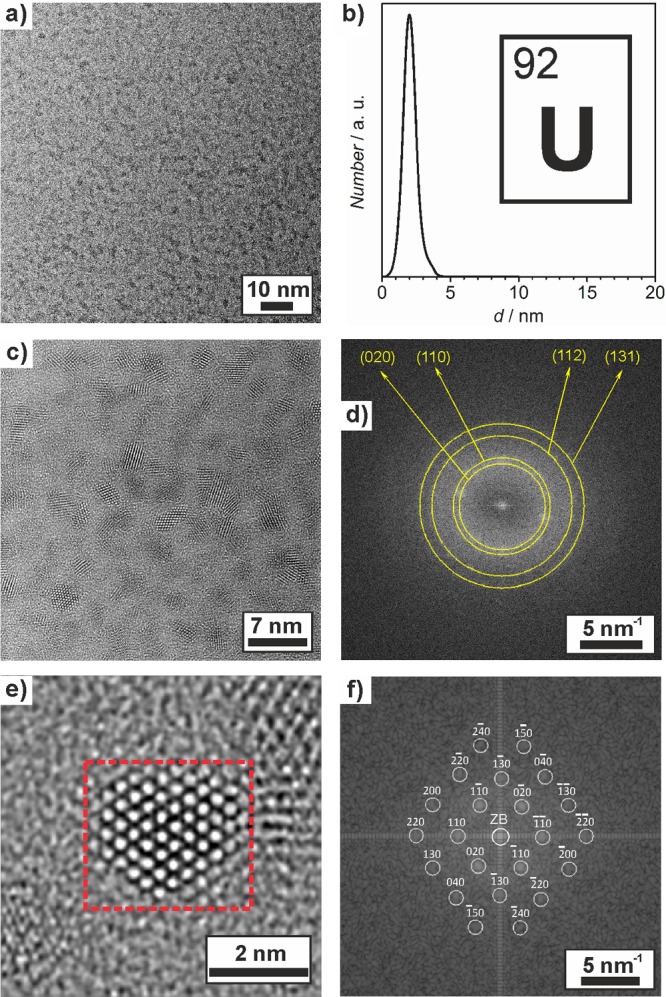
Figure 3.

Electron microscopy of the as-prepared U0 nanoparticles: (a) TEM overview image, (b) size distribution based on statistical evaluation of ≥100 nanoparticles on TEM images, (c) HRTEM image, (d) FFT analysis of a particle ensemble, (e) HRTEM image of a single particle, and (f) FFT analysis of the red marked area with calculated diffraction pattern of orthorhombic bulk α-U0 (a = 2.85, b = 5.87, and c = 4.96 Å along the [001] zone axis; ZB indicates the zero-order beam).
