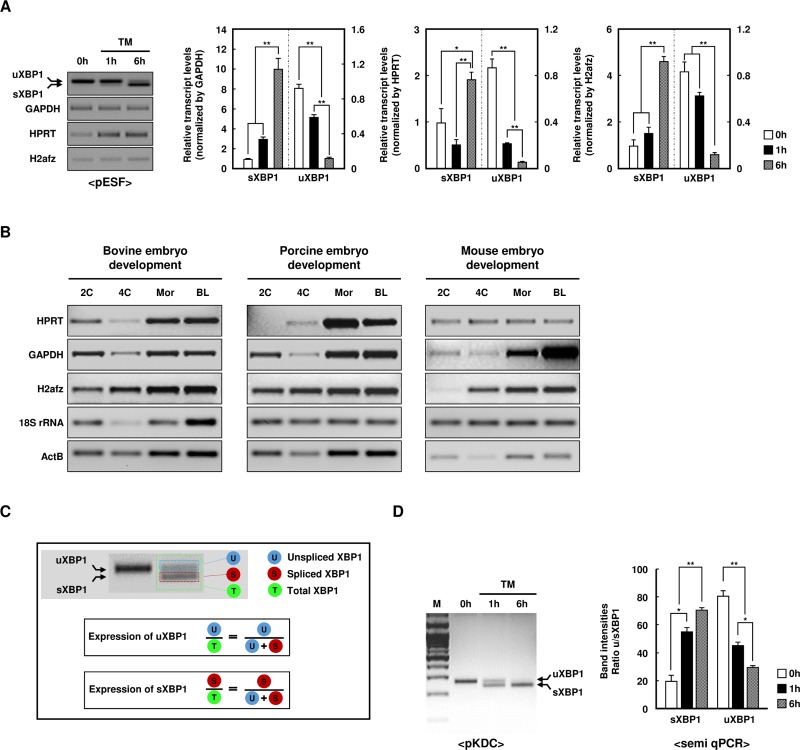
Fig 1. Detection of the XBP1 gene expression using the semi-quantitative polymerase chain reaction (semi-qPCR).
(A) Semi-qPCR analysis of unspliced/spliced (u/s) XBP1 and housekeeping genes (GAPDH, HPRT, or H2afz) using porcine ear skin fibroblast cells (pESF) following 0–6 h supplementation with tunicamycin at 2 μg/mL (TM; left panel). Densitometric analysis of the u/sXBP1 band intensities (right panel). GAPDH, HPRT, or H2afz was used as a normalization control (except in the first panel). Values represent the mean ± standard error (SE) (n = 3; *P < 0.05; **P < 0.01). (B) Semi-qPCR analysis of housekeeping genes (GAPDH, HPRT, H2afz, 18S rRNA, or ActB) during the early embryonic development stage (2-cell, 4-cell, morula, and blastocysts) in bovine, porcine, and mouse embryos. Three pools of 20 embryos were used for each developmental stage. (C) To measure the transcript levels of sXBP1, an indicator of endoplasmic reticulum (ER) stress, reverse transcription-PCR band intensities were densitometrically analyzed, and the levels of sXBP1 and uXBP1 relative to total XBP1 were calculated. (D) Semi-qPCR analysis of u/sXBP1 using porcine kidney-derived primary cells (pKDCs) following 6-h supplementation with TM (left panel). Densitometric analysis of the u/sXBP1 band intensity ratio (right panel). Values represent the mean ± SE (n = 3; *P < 0.05; **P < 0.01).

