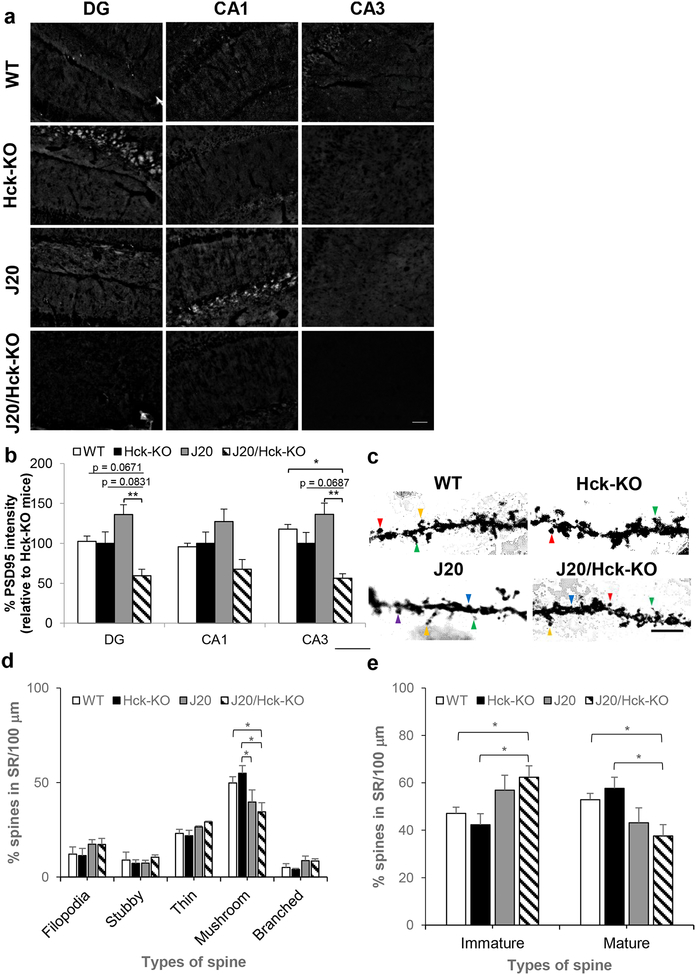
FIGURE 9.
Eliminating Hck in J20 mice significantly reduced intensity of PSD95 in the hippocampal DG and CA3 regions. (a) Representative images of PSD95 (post-synaptic protein marker) at the DG, CA1 and CA3 regions of the hippocampus of WT, Hck-KO, J20 and J20/Hck-KO mice (6–8 months old). Scale bar, 50 μm. (b) Quantitative analyses of % PSD95 intensities in WT, Hck-KO, J20 and J20/Hck-KO mice taken relative to that of Hck-KO mice revealed significant reduction in J20/Hck-KO mice at the DG (compared to J20 mice) and CA3 (compared to WT and J20 mice) regions. Data are expressed as mean ± SEM from one section per mouse with n = 6–8. * p < 0.05 and ** p < 0.01 between indicated genotypes. (c) Representative images of dendritic spines in 6–8 months old WT, Hck-KO, J20 and J20/Hck-KO mice were shown. Filopodia (yellow arrow), thin (green arrow), stubby (blue arrow), mushroom (red arrow), and branched (purple arrow) spines were indicated in the images. Scale bar, 5 μm. (d) Quantitative analyses of % filopodia, stubby, thin, mushroom and branched spines in the SR region of hippocampal CA1 per 100 μm dendrite analyzed revealed significant reduction of mushroom spine in J20/Hck-KO mice relative to WT or Hck-KO mice. (e) A replot of the data by expressing % immature (sum of filopodia, stubby and thin spines relative to total spine) and % mature (sum of mushroom and branched spines relative to total spine) spines showed more immature spine but fewer mature spine in J20/Hck-KO mice as compared to WT or Hck-KO mice. Data are expressed as mean ± SEM from 4 mice per genotype where 25–35 pyramidal neurons were analyzed for each mouse. * p < 0.05 relative to WT or Hck-KO mice.

