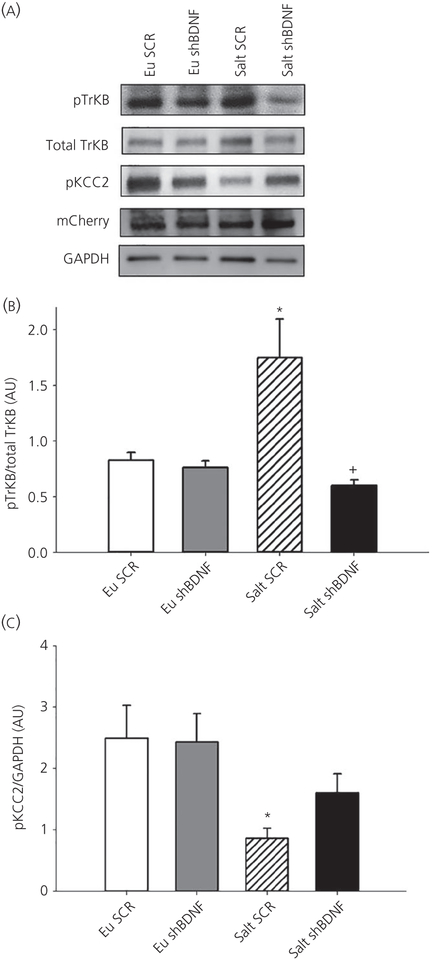
FIGURE 3.
A, Sample western blot images showing changes in protein expression of supraoptic nucleus (SON) punches. mCherry protein expression images shows successful injections at SON B, Quantification of phosphorylated tyrosine receptor kinase B (TrkB) (normalised to total TrkB). Data are the mean ± SEM. *P < 0.05 vs all other groups.+P < 0.05 vs salt scrambled (SCR). C, Phosphorylated KCC2 normalised to GAPDH. *P < 0.05 vs all other groups. Groups: euhydrated rats injected with SCR virus (Eu SCR, n = 6); euhydrated rats injected with shBDNF virus (Eu shBDNF, n = 6); salt loaded rats injected with SCR virus (Salt SCR, n = 8) and salt loaded rats injected with shBDNF virus (Salt shBDNF, n = 8)

