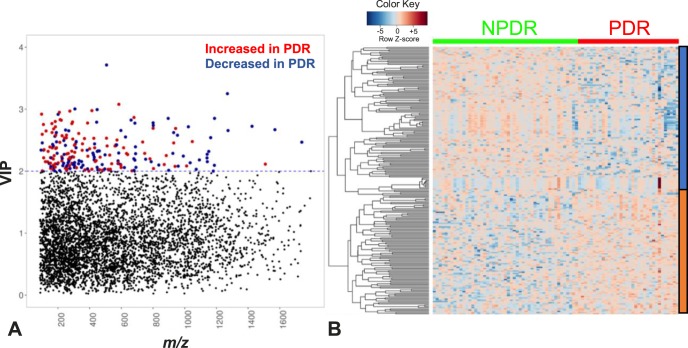
Figure 3.
Metabolic features that differ between NPDR and PDR patients. (A) Manhattan plot of the VIP and m/z of 10,306 features showing a total of 219 features were significantly different between PDR patients (n = 34) and NPDR patients (n = 49) using a VIP ≥ 2.0 (threshold indicated by the blue dashed horizontal line). Significant metabolic features increased (red dots) or decreased (blue dots) in PDR compared with NPDR patients are indicated. (B) One-way hierarchical clustering based on the intensity of significant metabolite features selected by PLS-DA (VIP ≥ 2.0, 219 m/z features) identified clusters of features that were increased (orange) or decreased (blue) in PDR patients.

