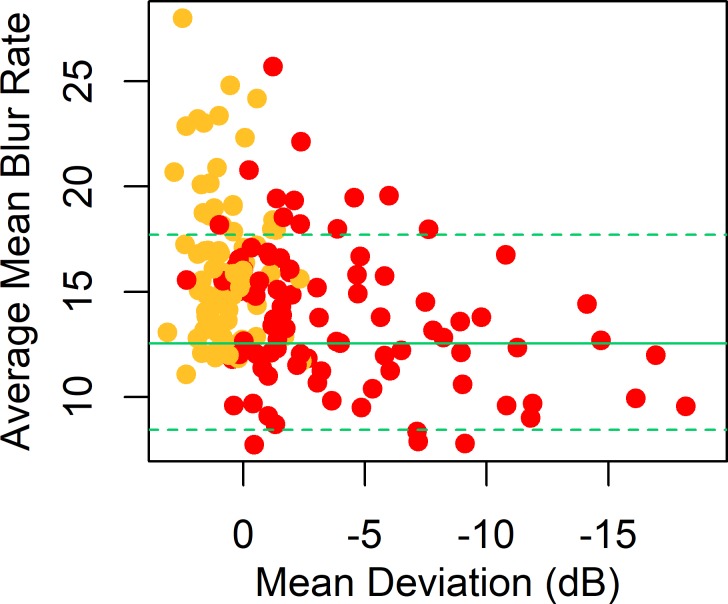
Figure 2.
MBRave in arbitrary units, plotted against MD from SAP, for eyes in the P3 cohort. MBRave is corrected to the equivalent value at age 60 years. Plotting symbols are red for eyes with existing functional loss according to the Glaucoma Hemifield Test and yellow for eyes without existing functional loss. Green horizontal lines show the mean (solid line) and 5th and 95th percentiles (dashed lines) among the control eyes.

