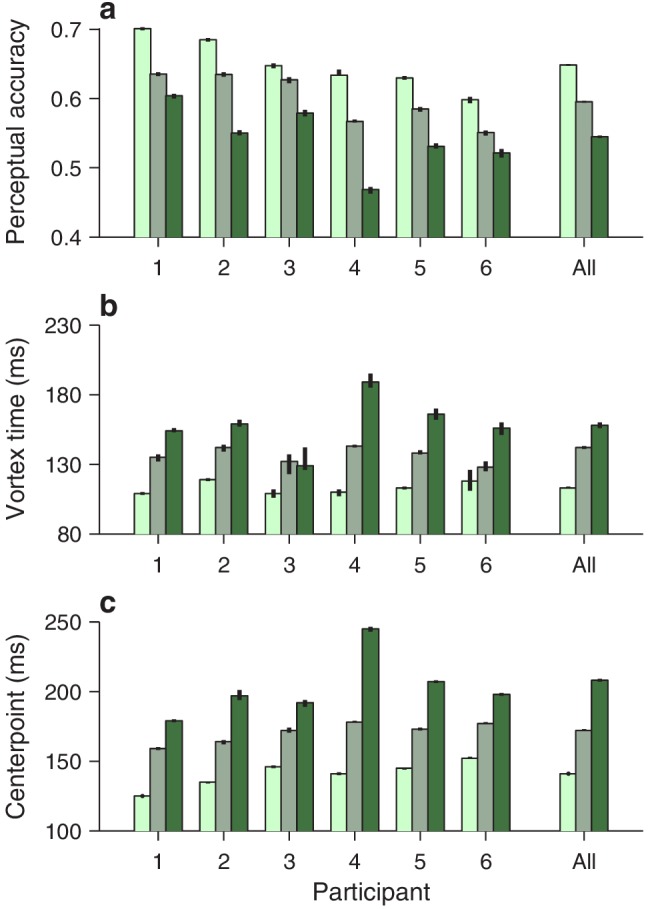
Figure 4. Perceptual performance quantified across participants and luminance conditions.
Each panel shows one particular quantity derived from the fitted tachometric curves, with results sorted by participant (x axes) and luminance level, high (bright green), medium (grayish green), and low (dark green). Error bars indicate 95% confidence intervals obtained by bootstrapping. (a) Mean perceptual accuracy, calculated as the average value of the fitted tachometric curve for rPTs between 0 and 250 ms. (b) Vortex time, calculated as the rPT at which the minimum of the fitted tachometric curve is found. (c) Endogenous response centerpoint, equal to the rPT at which the rise of the fitted tachometric curve is halfway between its minimum and maximum values.
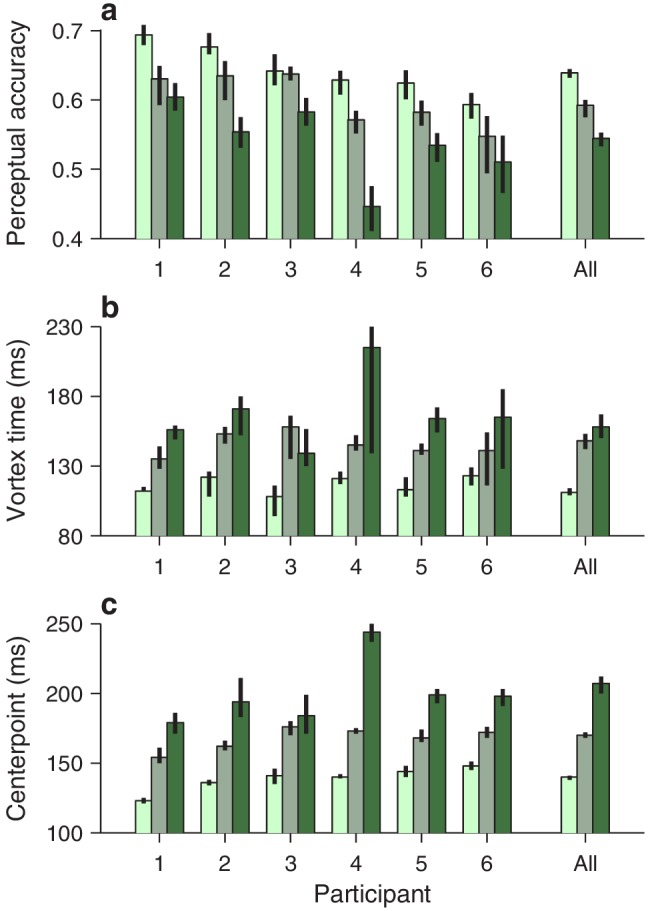
Figure 4—figure supplement 1. Additional quantities that characterize perceptual performance across participants and cue conditions.
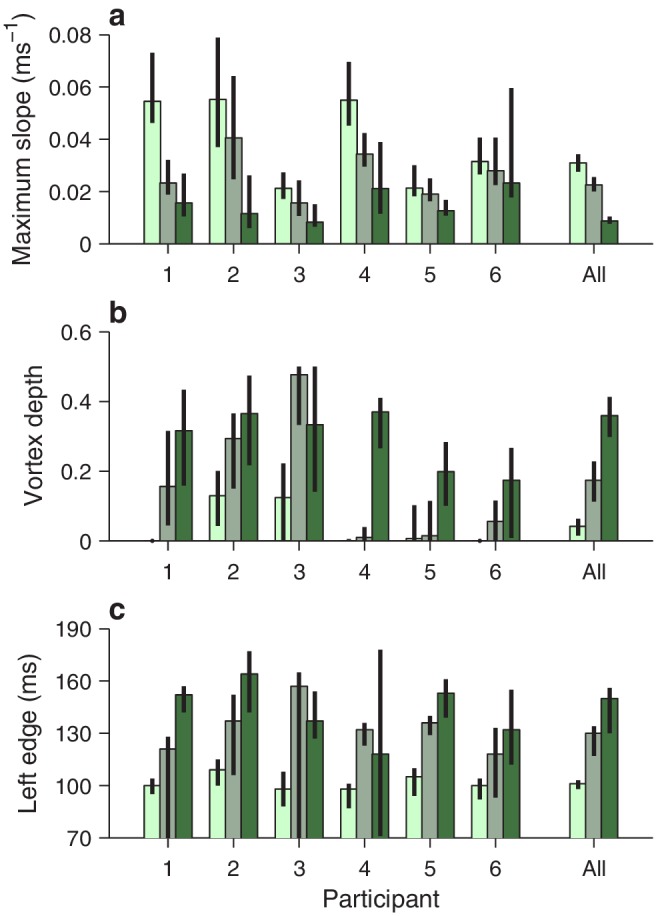
Each panel shows one particular feature derived from the fitted tachometric curves, with results sorted by participant (x axes) and luminance level, high (bright green), medium (grayish green), and low (dark green). Error bars indicate 95% confidence intervals obtained by bootstrapping. Same format as in Figure 4. (a) Maximum slope attained during the rising phase of the tachometric curve. (b) Vortex depth, equal to the minimum fraction correct. Note that, for participants 1, 4, and 6, the depth is zero for the high-luminance cue. (c) Left edge of the vortex, equal to the rPT at which the dip of the tachometric curve is halfway between chance (0.5) and its minimum value. Although these metrics are somewhat noisier than those shown in Figure 4, the effects of luminance are again highly consistent across participants, albeit with significant quantitative differences.
Figure 4—figure supplement 2. Simulated perceptual performance quantified in the same way as the experimental data.