. 2019 Jun 21;8:e46359. doi: 10.7554/eLife.46359

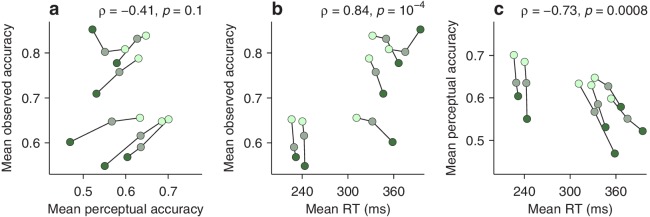
Figure 5. Dissociation between perceptual capacity and overall task performance.

In each panel, the data from each participant (joined by lines) are shown for trials of high, medium, and low luminance cues (bright, grayish, and dark green points, respectively). Crosses indicate the typical (median) uncertainty (2 SEs) associated with the measurement in each direction. Partial Spearman correlations between values on the x and y axes are indicated, along with significance (Materials and methods). The partial correlation eliminates the association due exclusively to luminance. (a) Mean observed accuracy versus mean perceptual accuracy. (b) Mean observed accuracy versus mean RT. Average RT data include both correct and incorrect trials. (c) Mean perceptual accuracy versus mean RT.

Figure 5.

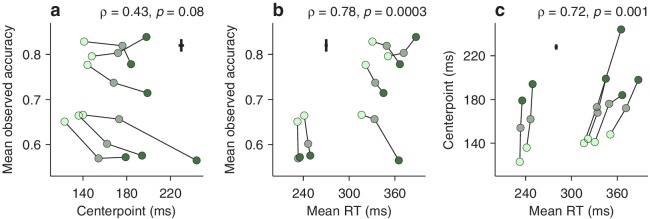
Figure 5—figure supplement 1. Dissociation between perceptual capacity and overall task performance based on the curve centerpoint.

Figure 5—figure supplement 1.

Same format as in Figure 5, except that the endogenous response centerpoint is plotted instead of the mean perceptual accuracy. (a) Mean observed accuracy as a function of the centerpoint. (b) Mean observed accuracy as a function of mean RT. (c) Centerpoint as a function of mean RT. The centerpoint relates to the mean observed accuracy and the mean RT (this figure) in nearly identical ways as the mean perceptual accuracy (Figure 5), if one takes into account that a lower centerpoint corresponds to better perceptual performance.
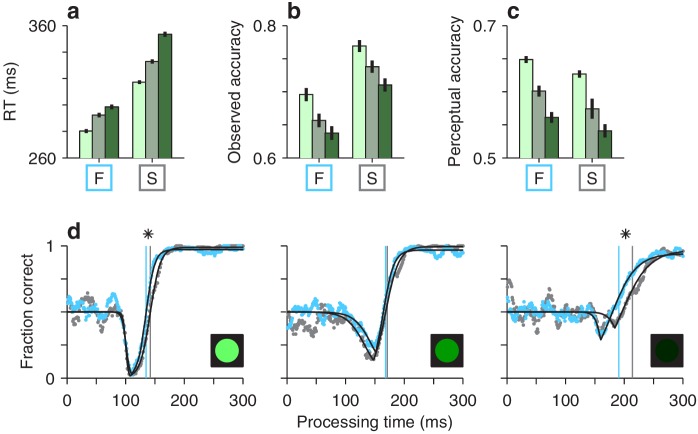
Figure 5—figure supplement 2. Decoupling perceptual and motor performance.

Figure 5—figure supplement 2.

All results are based on data aggregated across participants. Each panel compares results in fast (F) versus slow (S) blocks of trials, which were sorted as follows. First, the 30 blocks of trials performed by each participant were ranked, post hoc, according to mean RT. Then the 10 blocks at the top and the 10 at the bottom were designated as the fast and slow blocks, respectively. Finally, the fast and slow blocks were separately pooled across participants to yield two corresponding groups of trials. (a) Mean RT (± 1 SE) in compelled antisaccade trials. Bar colors, bright, grayish, and dark green, correspond to cue luminance, high, medium, and low, respectively. (b) Mean observed accuracy, equal to the measured fraction of correct responses (± 1 SE from binomial proportion), in compelled antisaccade trials. Note that, for a given luminance, the observed accuracy was higher in the slow than in the fast blocks. (c) Mean perceptual accuracy, equal to the mean value of the fitted tachometric curve over the 0–250 ms rPT range (± 1 SE from bootstrap). Note that perceptual accuracy was slightly lower in the slow than in the fast blocks. (d) Tachometric curves for fast (cyan dots) and slow blocks (gray dots). Each panel shows data for a specific cue luminance level, as indicated by the icons. Vertical lines mark the centerpoints of the fitted curves. In the high- and low-luminance cases, the blue curve is slightly shifted to the left relative to the gray (asterisks indicate p < 0.0005 for the difference in centerpoints, from bootstrap). This implies slightly better perceptual performance in the fast than in the slow blocks.
Figure 5—figure supplement 3. Dissociation between perceptual capacity and overall task performance as seen with the accelerated race-to-threshold model.

Figure 5—figure supplement 3.

Results were obtained in the exact same way as those in Figure 5, except that they were based on simulated trials. The model data were generated using the best-fitting model parameters for each individual participant. Same format as in Figure 5.
Figure 5—figure supplement 4. Model parameters that characterize individual perceptual performance.
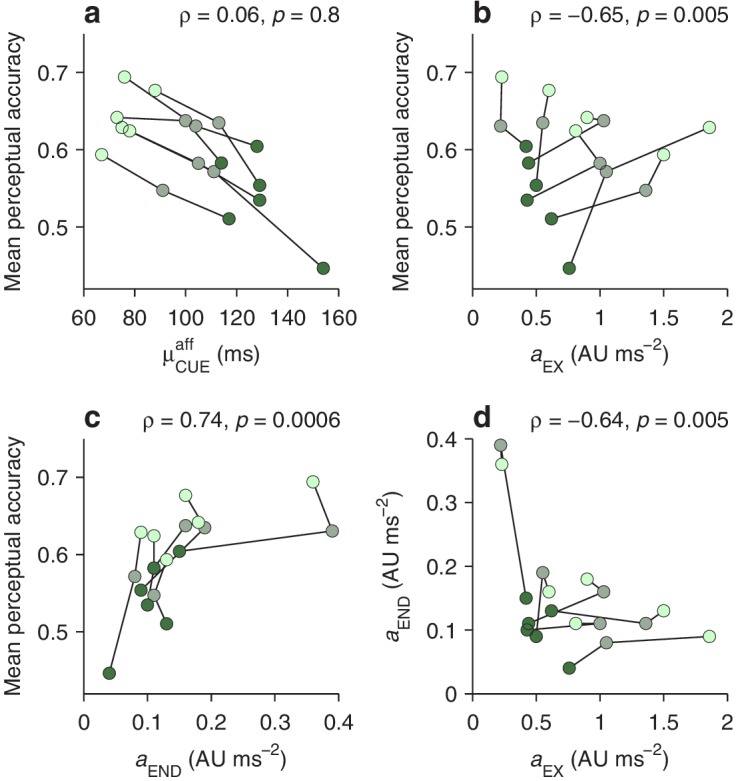
Figure 5—figure supplement 4.

In each panel, the data from each participant (joined by lines) are shown for trials of high, medium, and low luminance cues (bright, grayish, and dark green points, respectively). Parameter values are as listed in Supplementary file 1. Partial Spearman correlations between values on the x and y axes are indicated, along with significance (Materials and methods). The partial correlation eliminates the association due to luminance. (a) Mean perceptual accuracy as a function of the mean afferent delay of the cue (parameter μCUEaff, or mean cue latency). There seems to be a strong, negative association, but it is all due to mutual dependencies on luminance; within each luminance level, cue latency does not predict perceptual accuracy. This is an example of Simpson’s paradox, a statistical effect whereby a trend between two variables disappears or reverses when the data are conditioned on a third variable. (b) Mean perceptual accuracy as a function of the exogenous acceleration (parameter aEX). (c) Mean perceptual accuracy as a function of the endogenous acceleration (parameter aEND). (d) Correlation between endogenous and exogenous acceleration. The negative relationship indicates that participants whose attention is captured strongly by the cue also tend to endogenously shift their visuospatial attention more slowly. Other model parameters showed weaker relationships to perceptual accuracy.