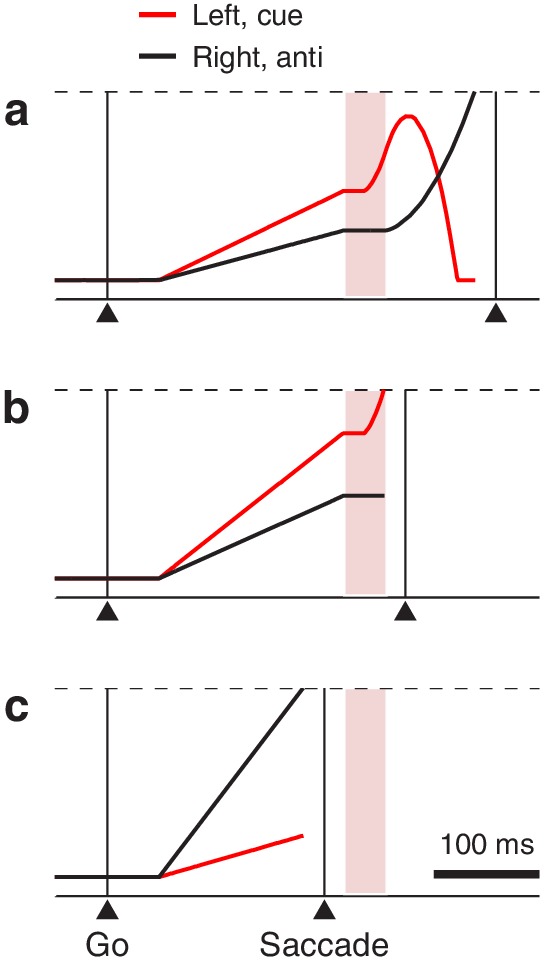
Figure 6. Three representative single trials of the race-to-threshold model.

Traces show motor plans toward the left (red) and toward the right (black) as functions of time. Because in these examples the cue is assumed to be on the left, these variables also correspond to motor plans toward the cue (red) and the anti location (black), respectively. After the exogenous response interval (ERI, pink shade), the former (incorrect) plan decelerates and the latter (correct) plan accelerates. A saccade is triggered a short efferent delay after activity reaches threshold (dashed lines). (a) A correct, long-rPT trial; that is, an informed choice (RT = 369 ms, rPT = 219 ms). (b) An incorrect trial with rPT within the vortex; that is, a captured saccade (RT = 283 ms, rPT = 133 ms). (c) A correct, short-rPT trial; that is, a correct guess (RT = 206 ms, rPT = 56 ms). In all examples, the gap is 150 ms. The influence of the cue depends on its timing relative to the ongoing motor activity.
