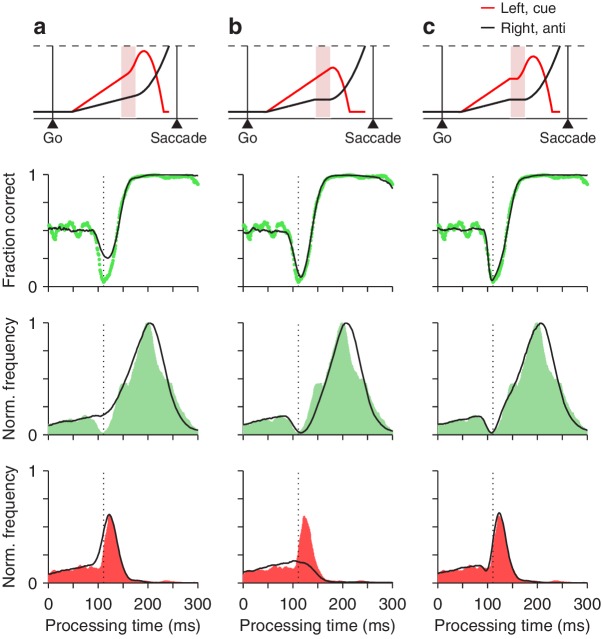
Figure 7. Contributions of two distinct neural mechanisms to attentional/oculomotor capture.
Top row: representative single, long-rPT trials from the model. Second row: tachometric curves, simulated (black traces) and experimental (green dots). Third row: rPT distributions for correct trials (), simulated (black traces) and experimental (green shades). Bottom row: rPT distributions for incorrect trials (), simulated (black traces) and experimental (red shades). (a) Results from a restricted version of the model in which, during the ERI, the motor plan toward the cue accelerates but the plan toward the anti location keeps advancing, unperturbed. (b) Results from another restricted version of the model in which, during the ERI, the motor plan toward the anti location halts but that toward the cue keeps advancing, unperturbed. (c) Results from the full-blown model, in which, during the ERI, the cue plan accelerates and the anti plan halts. For each model variant, results were obtained with the parameter values that minimized the error between the model and the pooled experimental data in the high luminance condition (Materials and methods).

