. 2019 Jul 22;8:e46566. doi: 10.7554/eLife.46566

Figure 2. Opa is required for the progression of temporal patterning of INPs.

(A) Close-up images of larval brains expressing RNAi against opa in INPs, stained for Dpn and D (induced with ermGal4, marked with membrane bound GFP). Lineages are outlined with yellow dashed line. (B) Close-up images of larval brains expressing RNAi against opa in INPs, stained for Dpn and Grh (induced with ermGal4, marked with membrane bound GFP). Lineages are outlined with yellow dashed line. (C) Close-up images of larval brains expressing RNAi against opa in INPs, stained for Dpn and Ey (induced with ermGal4, marked with membrane bound GFP). Lineages are outlined with yellow dashed line. (D) Quantification of INP numbers in different temporal stages identified by antibody staining of Dpn+, D+ cells, Dpn+, Grh+ cells, and Dpn+, Ey+ cells in control and opa knock-down brains, n = 10, total INP numbers in control were normalized to 100%. Data represent mean ± SD, ***p<=0.001, Student’s t-test (D+ INPs control 12.44 ± 1.42 [n = 10], opa RNAi 34.66 ± 1.02 [n = 12], p<0.001; Grh+ INPs control 8.5 ± 1.32 [n = 10], opa RNAi 0.5 ± 0.65 [n = 12], p<0.001; Ey+ INPs control 13.2 ± 0.98 [n = 10], opa RNAi 0.2 ± 0.4 [n = 10], p<0.001). (E) Control and opa mutant MARCM clones marked by membrane-bound GFP, stained for Dpn, Grh and D after 120 hr of induction. Control clone has D+, Dpn+ INPs followed by Grh+ INPs while opa mutant clone has increased number of D+ INPs and decreased number of Grh+ INPs. (F) Control and opa mutant MARCM clones marked by membrane-bound GFP, stained for Dpn, D and Ey after 120 hr of induction. Opa mutant clone has higher number of D+ INPs and lower number of Ey+ INPs. Scale bar 10 μm in all images.

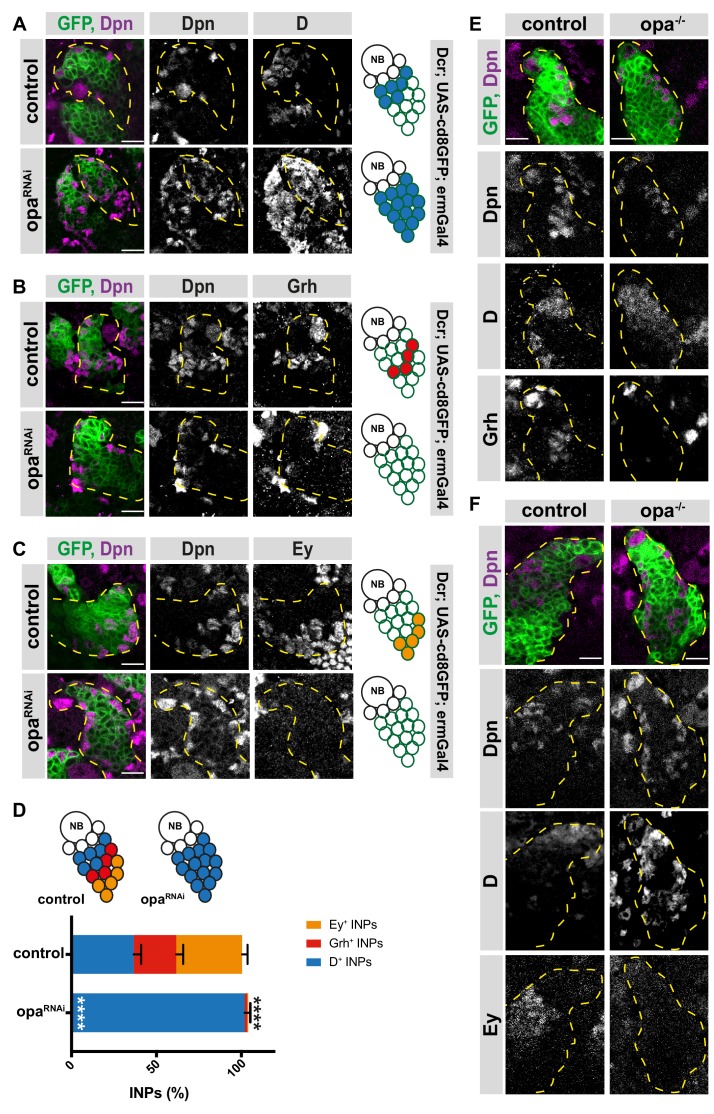
Figure 2—source data 1. Quantification of number of INPs in three different temporal identities between control versus opa-depleted brains with INP-specific driver (Figure 2D).
DOI: 10.7554/eLife.46566.016

Figure 2.

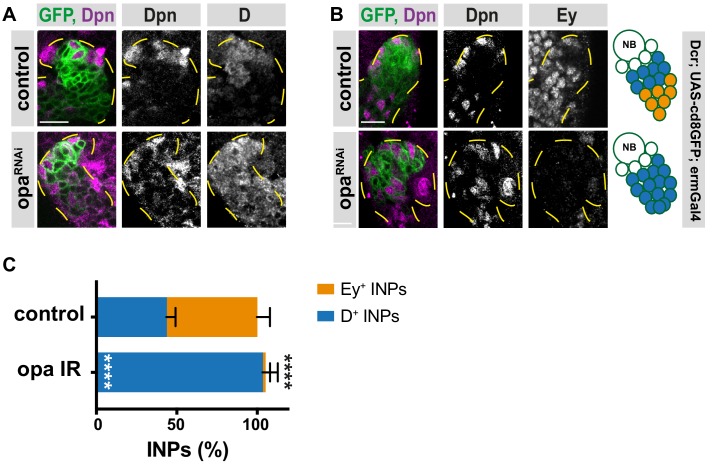
Figure 2—figure supplement 1. Opa is required for D repression.

Figure 2—figure supplement 1.

(A–B) Close-up images of larval brains expressing RNAi against opa in type II DM1 lineages, stained for Dpn, D (A), Dpn and Ey (B), lineages are outlined with yellow dashed line, scale bar 10 μm (induced with ermGal4, marked with membrane bound GFP). (C) Quantification of Dpn+, D+, and Dpn+, Ey+ INPs in control and opa knock-down brains, n = 5, total INP numbers in control were normalized to 100%. Data represent mean ± SD, ***p<=0.001, Student’s t-test. (D+ INPs control 11.14 ± 0.55 [n = 7], opa RNAi 26.43 ± 0.92 [n = 7], p<0.001; Ey+ INPs control 14.4 ± 0.92 [n = 5], opa RNAi 0.43 ± 0.29 [n = 7], p<0.001).
Figure 2—figure supplement 1—source data 1. Quantification of number of INPs in three different temporal identities between control versus opa-depleted brains with INP-specific driver in DM1 lineages (Figure 2—figure supplement 1C).
DOI: 10.7554/eLife.46566.017
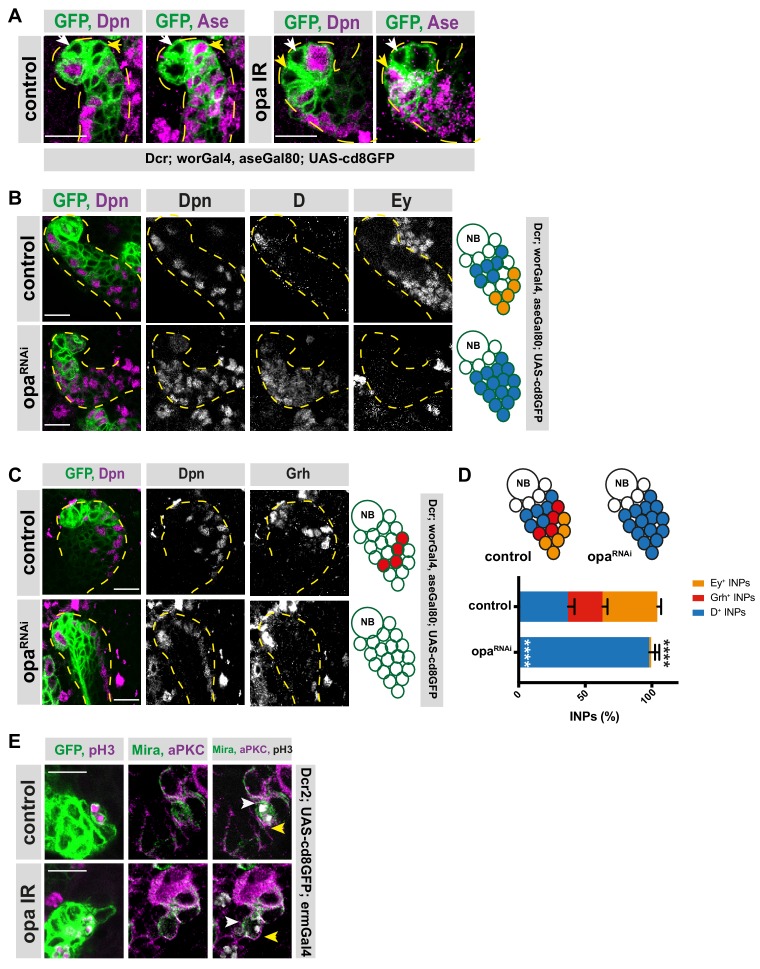
Figure 2—figure supplement 2. Opa regulates the transition from D-to-grh.

Figure 2—figure supplement 2.

(A) Close-up images of larval brains expressing RNAi against opa in type II lineages, stained for Dpn and Ase, lineages outlined with yellow dashed lines, Dpn-/Ase- INPs are marked with white arrowhead, Dpn-/Ase+ INPs are marked with yellow arrowhead, scale bar 10 μm (induced with worGal4, aseGal80, marked with membrane bound GFP). (B–C) Close-up images of larval brains expressing RNAi against opa in type II lineages, stained for Dpn, D and Ey (B), and Grh (C), lineages are outlined with yellow dashed line, scale bar 10 μm (induced with worGal4, aseGal80, marked with membrane bound GFP). (D) Quantification of Dpn+, D+, and Dpn+, Grh+, and Dpn+, Ey+ INPs in control and opa knock-down brains, n = 5, total INP numbers in control were normalized to 100%. Data represent mean ± SD, ***p<=0.001, Student’s t-test. (D+ INPs control 12.6 ± 1.5 [n = 5], opa RNAi 33.3 ± 2.35 [n = 6], p<0.001; Grh+ INPs control 8.8 ± 1.6 [n = 5], opa RNAi 0 [n = 6], p<0.001; Ey+ INPs control 14 ± 0.89 [n = 5], opa RNAi 0.5 ± 0.86 [n = 5], p<0.001). (E) Close-up images of larval brains expressing opa RNAi in INPs, stained for pH3, Mira and aPKC, the crescents of Mira staining are marked with white arrowhead, and the crescents of aPKC staining are marked with yellow arrowhead, scale bar 10 μm, (induced with ermGal4, marked with membrane bound GFP).
Figure 2—figure supplement 2—source data 2. Quantification of number of INPs in three different temporal identities between control versus opa-depleted brains with type II-specific driver (Figure 2—figure supplement 2D).
DOI: 10.7554/eLife.46566.018