. 2019 Jul 22;8:e46566. doi: 10.7554/eLife.46566

Figure 4. Osa initiates D expression before initiating Opa.

(A) Close-up images of fly brains endogenously expressing V5-tagged opa in INPs, stained for V5, Dpn and D. D+, V5- cell is marked with arrows, lineages are outlined with yellow dashed line, scale bar 10 μm and 5 μm, (induced with ermGal4, marked with membrane bound GFP). (B) Close-up images of fly brains endogenously expressing V5-tagged opa in INPs, stained for V5, Dpn and Grh, lineages are outlined with yellow dashed line, scale bar 10 μm, (induced with ermGal4, marked with membrane bound GFP). (C) Quantifications of opa::V5-signal intensity measurements of D+ vs D- INPs, n = 10, normalized to background intensity. Data represent mean ± SD, ***p<=0.001, Student’s t-test. (D) Quantifications of opa::V5-signal intensity measurements of Grh+ vs Grh- INPs, n = 10, normalized to background intensity. Data represent mean ± SD, ***p<=0.001, Student’s t-test. (E) Close-up images of fly brains endogenously expressing V5-tagged opa and RNAi for D in type II lineages, stained for V5, Dpn and D, lineages are outlined with yellow dashed line, scale bar 10 μm, (induced with worGal4, aseGal80, marked with membrane bound GFP). (F–G) Close up images of control versus opa and D double knock-down brains in type II lineages, stained with Dpn, D and Grh (C), or for Dpn, Ey and Ase (C) antibodies, lineages are outlined with yellow dashed lines, scale bar 10 μm, (induced with Dcr2; UAS-StgRFP; VT17-Gal4, marked with nuclear RFP).

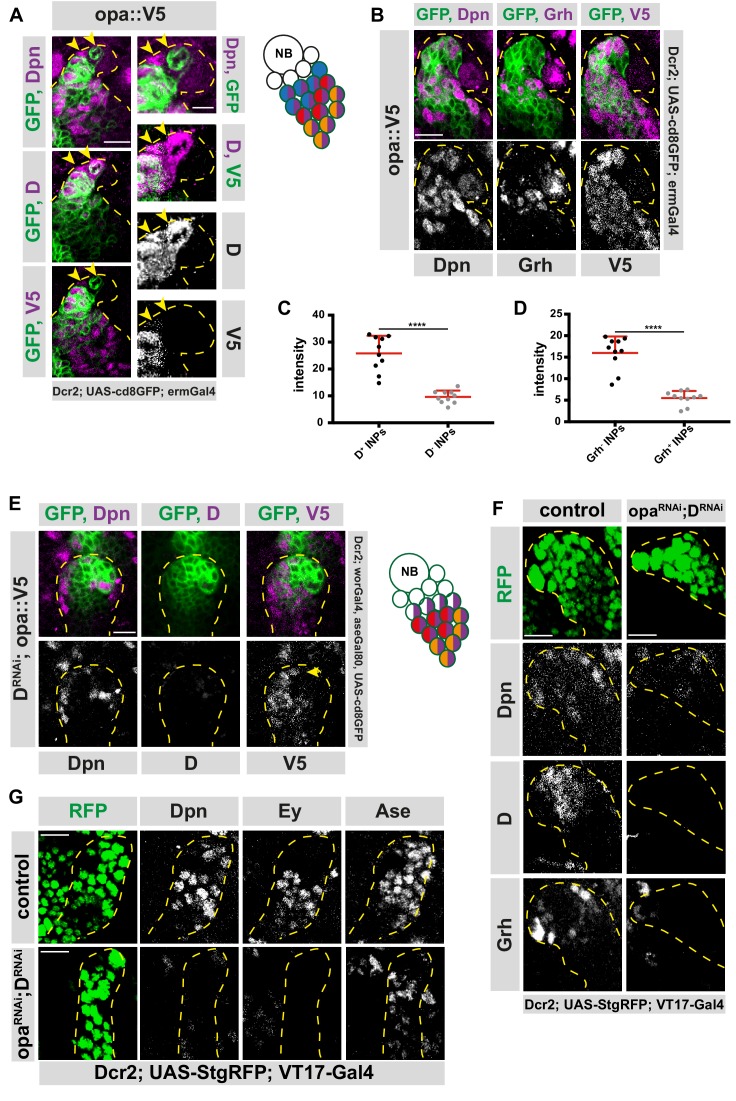
Figure 4—source data 1. Quantification of intensity measurements of opa::V5 signal in D+ versus D- INPs in wild-type brains (Figure 4C).
DOI: 10.7554/eLife.46566.026
Figure 4—source data 2. Quantification of intensity measurements of opa::V5 signal in Grh+ versus Grh- INPs in wild-type brains (Figure 4C).
DOI: 10.7554/eLife.46566.027

Figure 4.

Figure 4—figure supplement 1. Opa is expressed in type II lineages.

Figure 4—figure supplement 1.

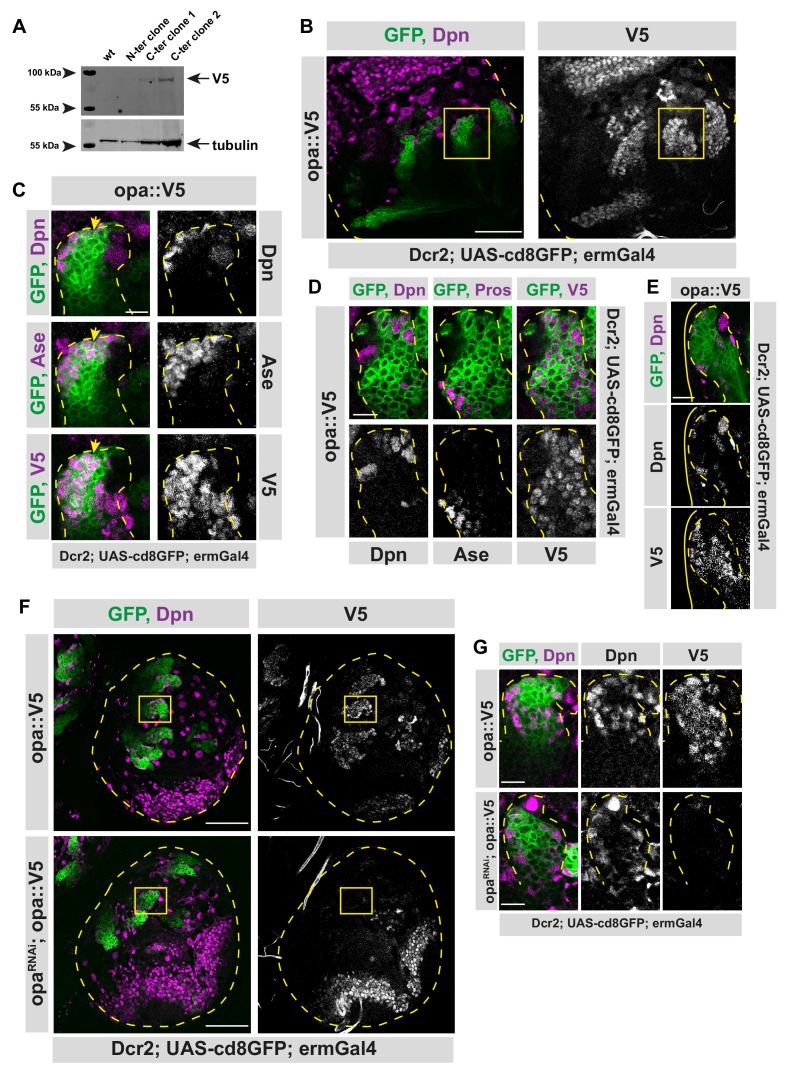
(A) Western blot confirmation of opa::V5 expressing flies. Wild-type embryos were used as control, three different clones were tested: two C-terminus tagged embryos and one N-terminus tagged embryos were used. Alpha-tubulin is used as loading control while V5 antibody was used for opa::V5 tag. (B) Opa is expressed in type II lineages. Overview image of brain lobe expressing endogenously V5-tagged opa, stained for Dpn and V5 antibodies, lobes are outlined with yellow dashed lines, scale bar 50 μm, (induced with ermGal4, marked with membrane bound GFP). (C) Close-up images of (B) marked with yellow square, stained for Dpn, Ase, and V5 antibodies. Type II lineage is outlined with yellow dashed lines, scale bar 10 μm, (induced with ermGal4, marked with membrane bound GFP). Yellow arrow is marking the start of opa expression. (D) Close-up images of brain lobes expressing endogenously V5-tagged opa, stained for Dpn, Prospero and V5 antibodies, lineages are outlined with yellow dashed lines, scale bar 10 μm, (induced with ermGal4, marked with membrane bound GFP). (E) Close-up images of DM1 lineage expressing endogenously V5-tagged opa, stained for Dpn and V5 antibodies, lineage is outlined with yellow dashed lines, while the brain lobe is outlined with yellow line (DM1 lineages can be deduced from their localization in the brain lobe), scale bar 10 μm, (induced with ermGal4, marked with membrane bound GFP). (F) Overview images of brain lobes expressing opa-V5 alone or along with opa RNAi in type II lineages, stained for Dpn and V5 antibodies, lobes are outlined with yellow dashed lines, scale bar 50 μm, (induced with worGal4, aseGal80, marked with membrane bound GFP). (G) Close up images of (F) marked with yellow square, stained with Dpn and V5 antibodies. Type II lineages are outlined with yellow dashed lines, scale bar 10 μm, (induced with worGal4, aseGal80, marked with membrane bound GFP).
Figure 4—figure supplement 2. Osa initiates the expression of opa in INPs.

Figure 4—figure supplement 2.

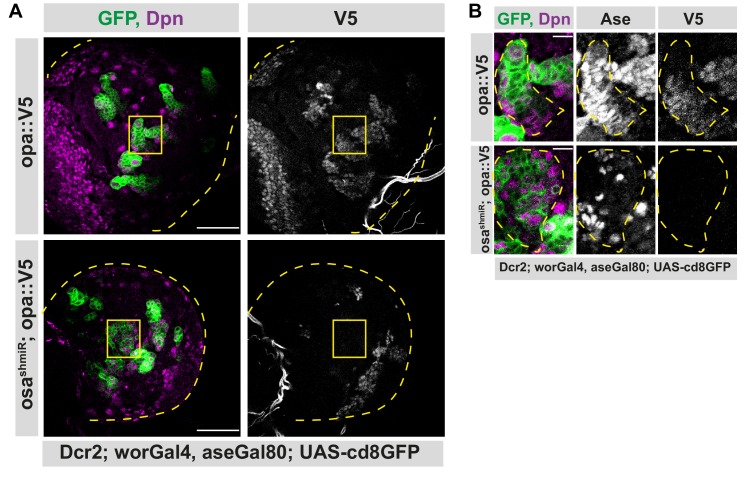
(A) Opa is induced directly by Osa. Overview images of brain lobes expressing opa-V5 alone or along with osa shmiR in type II lineages, stained for Dpn and V5 antibodies, lobes are outlined with yellow dashed lines, scale bar 50 μm, (induced with worGal4, aseGal80, marked with membrane bound GFP). Osa knock-down causes the loss of V5 expression in type II lineages. (B) Close-up images of (A) marked with yellow square, stained with Dpn, V5 and Ase antibodies. Type II lineage is outlined with yellow dashed lines, scale bar 10 μm, (induced with worGal4, aseGal80, marked with membrane bound GFP). Knock-down of Osa causes higher numbers of Dpn+ cells which are V5-.
Figure 4—figure supplement 3. Different temporal states have different opa levels.

Figure 4—figure supplement 3.

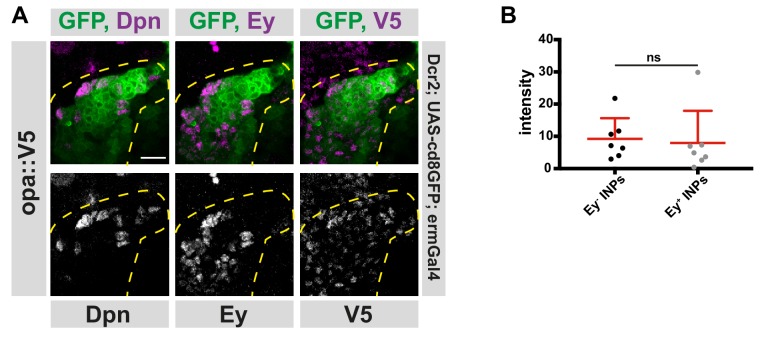
(A) Close-up images of fly brains endogenously expressing V5-tagged opa in INPs, stained for V5, Dpn and Ey. Lineages are outlined with yellow dashed line, scale bar 10 μm, (induced with ermGal4, marked with membrane bound GFP). (B) Quantifications of opa::V5-signal intensity measurements of Ey+ vs Ey- INPs, n = 7, normalized to background intensity. Data represent mean ± SD, not significant, Student’s t-test.
Figure 4—figure supplement 3—source data 1. Quantification of intensity measurements of opa::V5 signal in Ey+ versus Ey- INPs in wild-type brains (Figure 4—figure supplement 3B).
DOI: 10.7554/eLife.46566.028